Taiwanese vs Luxembourger Seniors Poverty Over the Age of 65
COMPARE
Taiwanese
Luxembourger
Seniors Poverty Over the Age of 65
Seniors Poverty Over the Age of 65 Comparison
Taiwanese
Luxembourgers
11.2%
SENIORS POVERTY OVER THE AGE OF 65
29.2/ 100
METRIC RATING
193rd/ 347
METRIC RANK
9.2%
SENIORS POVERTY OVER THE AGE OF 65
99.9/ 100
METRIC RATING
21st/ 347
METRIC RANK
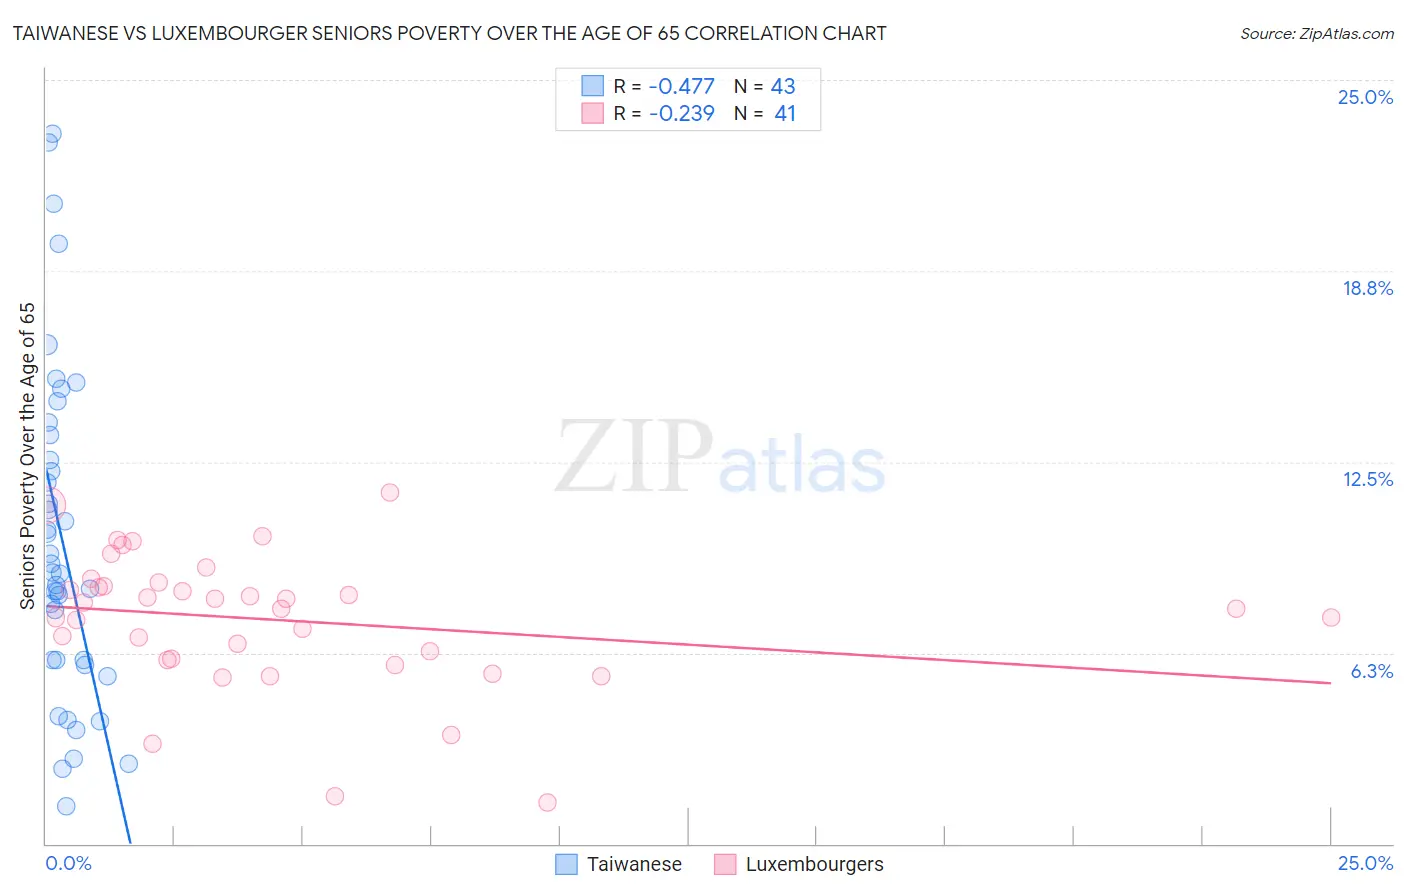
Taiwanese vs Luxembourger Seniors Poverty Over the Age of 65 Correlation Chart
The statistical analysis conducted on geographies consisting of 31,675,207 people shows a moderate negative correlation between the proportion of Taiwanese and poverty level among seniors over the age of 65 in the United States with a correlation coefficient (R) of -0.477 and weighted average of 11.2%. Similarly, the statistical analysis conducted on geographies consisting of 144,471,416 people shows a weak negative correlation between the proportion of Luxembourgers and poverty level among seniors over the age of 65 in the United States with a correlation coefficient (R) of -0.239 and weighted average of 9.2%, a difference of 20.6%.
Seniors Poverty Over the Age of 65 Correlation Summary
| Measurement | Taiwanese | Luxembourger |
| Minimum | 1.2% | 1.3% |
| Maximum | 23.2% | 11.5% |
| Range | 22.0% | 10.2% |
| Mean | 9.9% | 7.3% |
| Median | 8.9% | 7.7% |
| Interquartile 25% (IQ1) | 6.0% | 6.0% |
| Interquartile 75% (IQ3) | 13.4% | 8.5% |
| Interquartile Range (IQR) | 7.4% | 2.5% |
| Standard Deviation (Sample) | 5.4% | 2.2% |
| Standard Deviation (Population) | 5.4% | 2.2% |
Similar Demographics by Seniors Poverty Over the Age of 65
Demographics Similar to Taiwanese by Seniors Poverty Over the Age of 65
In terms of seniors poverty over the age of 65, the demographic groups most similar to Taiwanese are Immigrants from Southern Europe (11.1%, a difference of 0.090%), Chilean (11.2%, a difference of 0.15%), Immigrants from Vietnam (11.2%, a difference of 0.29%), Immigrants from Uganda (11.1%, a difference of 0.30%), and Bangladeshi (11.2%, a difference of 0.45%).
| Demographics | Rating | Rank | Seniors Poverty Over the Age of 65 |
| Immigrants | Eastern Asia | 37.5 /100 | #186 | Fair 11.1% |
| Immigrants | Middle Africa | 37.4 /100 | #187 | Fair 11.1% |
| Immigrants | Hong Kong | 36.3 /100 | #188 | Fair 11.1% |
| Immigrants | Laos | 35.7 /100 | #189 | Fair 11.1% |
| Indians (Asian) | 34.2 /100 | #190 | Fair 11.1% |
| Immigrants | Uganda | 32.2 /100 | #191 | Fair 11.1% |
| Immigrants | Southern Europe | 30.1 /100 | #192 | Fair 11.1% |
| Taiwanese | 29.2 /100 | #193 | Fair 11.2% |
| Chileans | 27.8 /100 | #194 | Fair 11.2% |
| Immigrants | Vietnam | 26.6 /100 | #195 | Fair 11.2% |
| Bangladeshis | 25.2 /100 | #196 | Fair 11.2% |
| Albanians | 24.4 /100 | #197 | Fair 11.2% |
| Immigrants | Burma/Myanmar | 21.3 /100 | #198 | Fair 11.3% |
| Immigrants | Israel | 20.3 /100 | #199 | Fair 11.3% |
| Alsatians | 20.1 /100 | #200 | Fair 11.3% |
Demographics Similar to Luxembourgers by Seniors Poverty Over the Age of 65
In terms of seniors poverty over the age of 65, the demographic groups most similar to Luxembourgers are Slovene (9.3%, a difference of 0.030%), Welsh (9.3%, a difference of 0.080%), Bulgarian (9.3%, a difference of 0.16%), Thai (9.2%, a difference of 0.29%), and Swiss (9.2%, a difference of 0.43%).
| Demographics | Rating | Rank | Seniors Poverty Over the Age of 65 |
| Poles | 99.9 /100 | #14 | Exceptional 9.1% |
| Dutch | 99.9 /100 | #15 | Exceptional 9.1% |
| Europeans | 99.9 /100 | #16 | Exceptional 9.2% |
| Scottish | 99.9 /100 | #17 | Exceptional 9.2% |
| Slovaks | 99.9 /100 | #18 | Exceptional 9.2% |
| Swiss | 99.9 /100 | #19 | Exceptional 9.2% |
| Thais | 99.9 /100 | #20 | Exceptional 9.2% |
| Luxembourgers | 99.9 /100 | #21 | Exceptional 9.2% |
| Slovenes | 99.9 /100 | #22 | Exceptional 9.3% |
| Welsh | 99.9 /100 | #23 | Exceptional 9.3% |
| Bulgarians | 99.9 /100 | #24 | Exceptional 9.3% |
| Irish | 99.9 /100 | #25 | Exceptional 9.3% |
| Immigrants | Scotland | 99.9 /100 | #26 | Exceptional 9.3% |
| Italians | 99.9 /100 | #27 | Exceptional 9.3% |
| Tongans | 99.9 /100 | #28 | Exceptional 9.3% |