Taiwanese vs Immigrants from Jordan Seniors Poverty Over the Age of 65
COMPARE
Taiwanese
Immigrants from Jordan
Seniors Poverty Over the Age of 65
Seniors Poverty Over the Age of 65 Comparison
Taiwanese
Immigrants from Jordan
11.2%
SENIORS POVERTY OVER THE AGE OF 65
29.2/ 100
METRIC RATING
193rd/ 347
METRIC RANK
10.2%
SENIORS POVERTY OVER THE AGE OF 65
94.7/ 100
METRIC RATING
101st/ 347
METRIC RANK
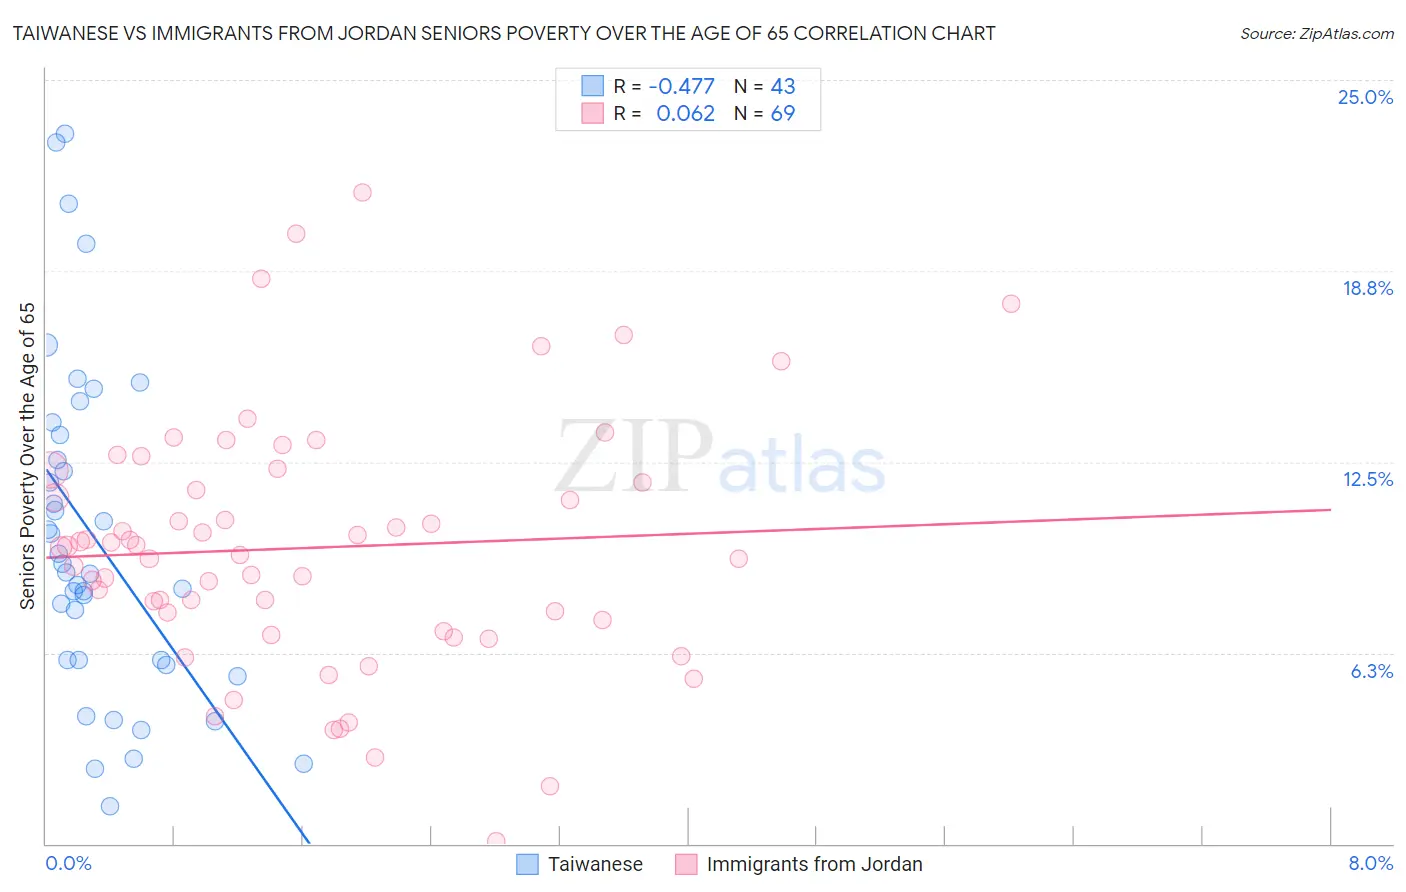
Taiwanese vs Immigrants from Jordan Seniors Poverty Over the Age of 65 Correlation Chart
The statistical analysis conducted on geographies consisting of 31,675,207 people shows a moderate negative correlation between the proportion of Taiwanese and poverty level among seniors over the age of 65 in the United States with a correlation coefficient (R) of -0.477 and weighted average of 11.2%. Similarly, the statistical analysis conducted on geographies consisting of 181,113,233 people shows a slight positive correlation between the proportion of Immigrants from Jordan and poverty level among seniors over the age of 65 in the United States with a correlation coefficient (R) of 0.062 and weighted average of 10.2%, a difference of 8.9%.
Seniors Poverty Over the Age of 65 Correlation Summary
| Measurement | Taiwanese | Immigrants from Jordan |
| Minimum | 1.2% | 0.093% |
| Maximum | 23.2% | 21.3% |
| Range | 22.0% | 21.2% |
| Mean | 9.9% | 9.7% |
| Median | 8.9% | 9.7% |
| Interquartile 25% (IQ1) | 6.0% | 7.1% |
| Interquartile 75% (IQ3) | 13.4% | 12.0% |
| Interquartile Range (IQR) | 7.4% | 4.9% |
| Standard Deviation (Sample) | 5.4% | 4.1% |
| Standard Deviation (Population) | 5.4% | 4.1% |
Similar Demographics by Seniors Poverty Over the Age of 65
Demographics Similar to Taiwanese by Seniors Poverty Over the Age of 65
In terms of seniors poverty over the age of 65, the demographic groups most similar to Taiwanese are Immigrants from Southern Europe (11.1%, a difference of 0.090%), Chilean (11.2%, a difference of 0.15%), Immigrants from Vietnam (11.2%, a difference of 0.29%), Immigrants from Uganda (11.1%, a difference of 0.30%), and Bangladeshi (11.2%, a difference of 0.45%).
| Demographics | Rating | Rank | Seniors Poverty Over the Age of 65 |
| Immigrants | Eastern Asia | 37.5 /100 | #186 | Fair 11.1% |
| Immigrants | Middle Africa | 37.4 /100 | #187 | Fair 11.1% |
| Immigrants | Hong Kong | 36.3 /100 | #188 | Fair 11.1% |
| Immigrants | Laos | 35.7 /100 | #189 | Fair 11.1% |
| Indians (Asian) | 34.2 /100 | #190 | Fair 11.1% |
| Immigrants | Uganda | 32.2 /100 | #191 | Fair 11.1% |
| Immigrants | Southern Europe | 30.1 /100 | #192 | Fair 11.1% |
| Taiwanese | 29.2 /100 | #193 | Fair 11.2% |
| Chileans | 27.8 /100 | #194 | Fair 11.2% |
| Immigrants | Vietnam | 26.6 /100 | #195 | Fair 11.2% |
| Bangladeshis | 25.2 /100 | #196 | Fair 11.2% |
| Albanians | 24.4 /100 | #197 | Fair 11.2% |
| Immigrants | Burma/Myanmar | 21.3 /100 | #198 | Fair 11.3% |
| Immigrants | Israel | 20.3 /100 | #199 | Fair 11.3% |
| Alsatians | 20.1 /100 | #200 | Fair 11.3% |
Demographics Similar to Immigrants from Jordan by Seniors Poverty Over the Age of 65
In terms of seniors poverty over the age of 65, the demographic groups most similar to Immigrants from Jordan are Delaware (10.2%, a difference of 0.10%), Icelander (10.3%, a difference of 0.15%), South African (10.3%, a difference of 0.19%), Aleut (10.3%, a difference of 0.26%), and Kenyan (10.3%, a difference of 0.28%).
| Demographics | Rating | Rank | Seniors Poverty Over the Age of 65 |
| Immigrants | Germany | 96.7 /100 | #94 | Exceptional 10.1% |
| Immigrants | Japan | 96.3 /100 | #95 | Exceptional 10.1% |
| Basques | 95.9 /100 | #96 | Exceptional 10.2% |
| Immigrants | Pakistan | 95.7 /100 | #97 | Exceptional 10.2% |
| Immigrants | Kuwait | 95.5 /100 | #98 | Exceptional 10.2% |
| Cypriots | 95.5 /100 | #99 | Exceptional 10.2% |
| Marshallese | 95.3 /100 | #100 | Exceptional 10.2% |
| Immigrants | Jordan | 94.7 /100 | #101 | Exceptional 10.2% |
| Delaware | 94.5 /100 | #102 | Exceptional 10.2% |
| Icelanders | 94.4 /100 | #103 | Exceptional 10.3% |
| South Africans | 94.3 /100 | #104 | Exceptional 10.3% |
| Aleuts | 94.1 /100 | #105 | Exceptional 10.3% |
| Kenyans | 94.1 /100 | #106 | Exceptional 10.3% |
| Hawaiians | 93.9 /100 | #107 | Exceptional 10.3% |
| Immigrants | Croatia | 93.9 /100 | #108 | Exceptional 10.3% |