Taiwanese vs Immigrants from Guyana Median Female Earnings
COMPARE
Taiwanese
Immigrants from Guyana
Median Female Earnings
Median Female Earnings Comparison
Taiwanese
Immigrants from Guyana
$40,576
MEDIAN FEMALE EARNINGS
86.1/ 100
METRIC RATING
138th/ 347
METRIC RANK
$40,773
MEDIAN FEMALE EARNINGS
90.3/ 100
METRIC RATING
130th/ 347
METRIC RANK
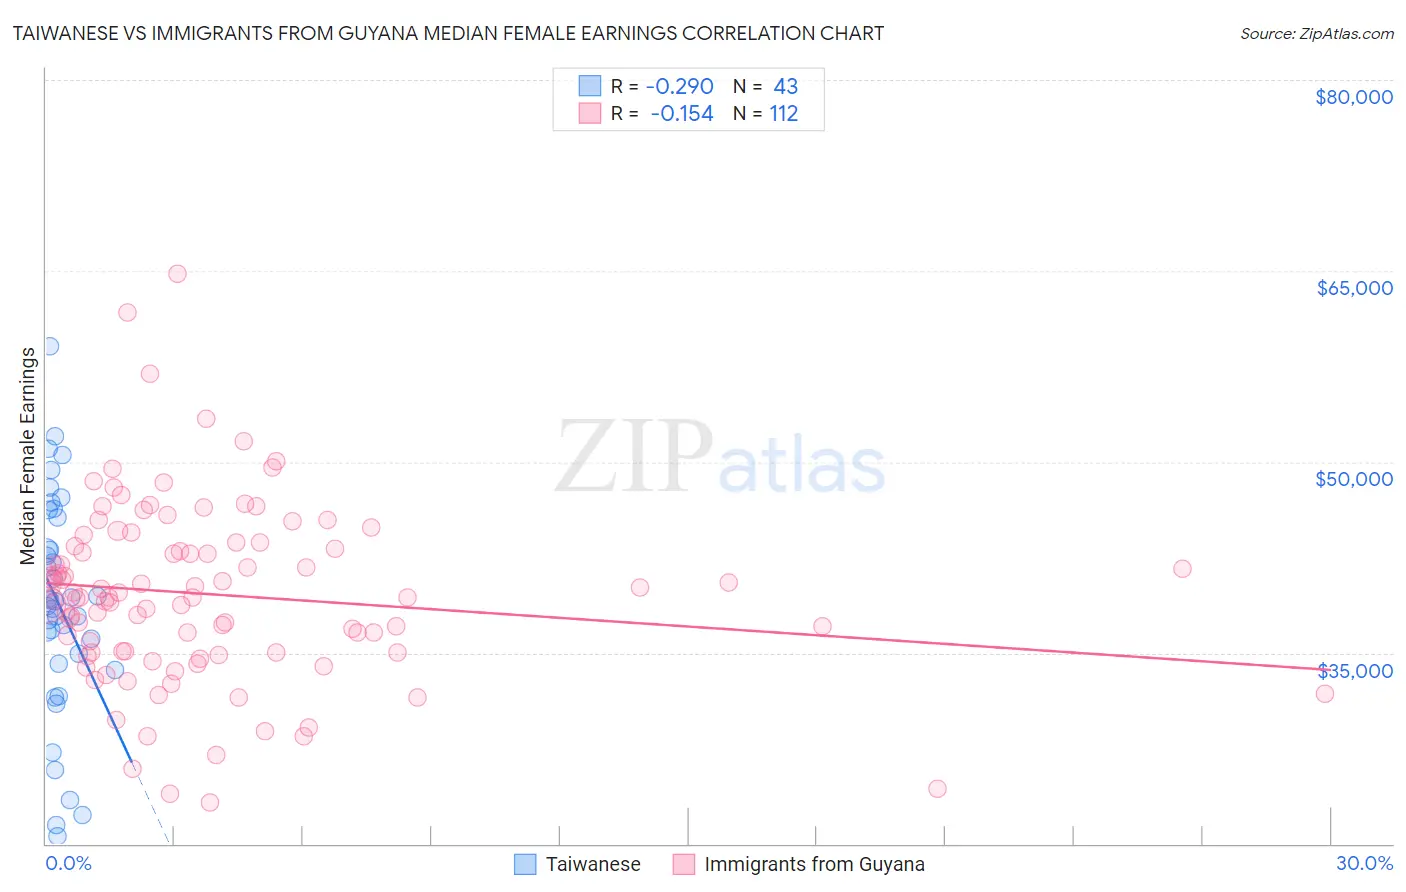
Taiwanese vs Immigrants from Guyana Median Female Earnings Correlation Chart
The statistical analysis conducted on geographies consisting of 31,721,885 people shows a weak negative correlation between the proportion of Taiwanese and median female earnings in the United States with a correlation coefficient (R) of -0.290 and weighted average of $40,576. Similarly, the statistical analysis conducted on geographies consisting of 183,689,123 people shows a poor negative correlation between the proportion of Immigrants from Guyana and median female earnings in the United States with a correlation coefficient (R) of -0.154 and weighted average of $40,773, a difference of 0.49%.
Median Female Earnings Correlation Summary
| Measurement | Taiwanese | Immigrants from Guyana |
| Minimum | $20,555 | $23,277 |
| Maximum | $59,093 | $64,779 |
| Range | $38,538 | $41,502 |
| Mean | $38,751 | $39,583 |
| Median | $39,019 | $39,337 |
| Interquartile 25% (IQ1) | $34,095 | $35,009 |
| Interquartile 75% (IQ3) | $45,655 | $43,513 |
| Interquartile Range (IQR) | $11,560 | $8,503 |
| Standard Deviation (Sample) | $8,643 | $7,079 |
| Standard Deviation (Population) | $8,542 | $7,048 |
Demographics Similar to Taiwanese and Immigrants from Guyana by Median Female Earnings
In terms of median female earnings, the demographic groups most similar to Taiwanese are Immigrants from South Eastern Asia ($40,558, a difference of 0.040%), Pakistani ($40,596, a difference of 0.050%), Serbian ($40,539, a difference of 0.090%), Immigrants from Eastern Africa ($40,644, a difference of 0.17%), and Immigrants from Syria ($40,499, a difference of 0.19%). Similarly, the demographic groups most similar to Immigrants from Guyana are Chilean ($40,757, a difference of 0.040%), Zimbabwean ($40,798, a difference of 0.060%), Immigrants from Uganda ($40,739, a difference of 0.080%), Syrian ($40,727, a difference of 0.11%), and Carpatho Rusyn ($40,825, a difference of 0.13%).
| Demographics | Rating | Rank | Median Female Earnings |
| Trinidadians and Tobagonians | 93.2 /100 | #124 | Exceptional $40,958 |
| Austrians | 92.7 /100 | #125 | Exceptional $40,923 |
| Immigrants | Trinidad and Tobago | 92.3 /100 | #126 | Exceptional $40,895 |
| Ugandans | 92.2 /100 | #127 | Exceptional $40,889 |
| Carpatho Rusyns | 91.2 /100 | #128 | Exceptional $40,825 |
| Zimbabweans | 90.8 /100 | #129 | Exceptional $40,798 |
| Immigrants | Guyana | 90.3 /100 | #130 | Exceptional $40,773 |
| Chileans | 90.0 /100 | #131 | Exceptional $40,757 |
| Immigrants | Uganda | 89.7 /100 | #132 | Excellent $40,739 |
| Syrians | 89.5 /100 | #133 | Excellent $40,727 |
| Arabs | 89.3 /100 | #134 | Excellent $40,718 |
| Immigrants | Nepal | 89.0 /100 | #135 | Excellent $40,704 |
| Immigrants | Eastern Africa | 87.7 /100 | #136 | Excellent $40,644 |
| Pakistanis | 86.6 /100 | #137 | Excellent $40,596 |
| Taiwanese | 86.1 /100 | #138 | Excellent $40,576 |
| Immigrants | South Eastern Asia | 85.7 /100 | #139 | Excellent $40,558 |
| Serbians | 85.2 /100 | #140 | Excellent $40,539 |
| Immigrants | Syria | 84.1 /100 | #141 | Excellent $40,499 |
| Sri Lankans | 84.0 /100 | #142 | Excellent $40,496 |
| Northern Europeans | 83.9 /100 | #143 | Excellent $40,491 |
| Immigrants | North Macedonia | 83.8 /100 | #144 | Excellent $40,488 |