Immigrants from Ukraine vs Immigrants from Guyana Seniors Poverty Over the Age of 65
COMPARE
Immigrants from Ukraine
Immigrants from Guyana
Seniors Poverty Over the Age of 65
Seniors Poverty Over the Age of 65 Comparison
Immigrants from Ukraine
Immigrants from Guyana
11.6%
SENIORS POVERTY OVER THE AGE OF 65
5.7/ 100
METRIC RATING
218th/ 347
METRIC RANK
14.5%
SENIORS POVERTY OVER THE AGE OF 65
0.0/ 100
METRIC RATING
316th/ 347
METRIC RANK
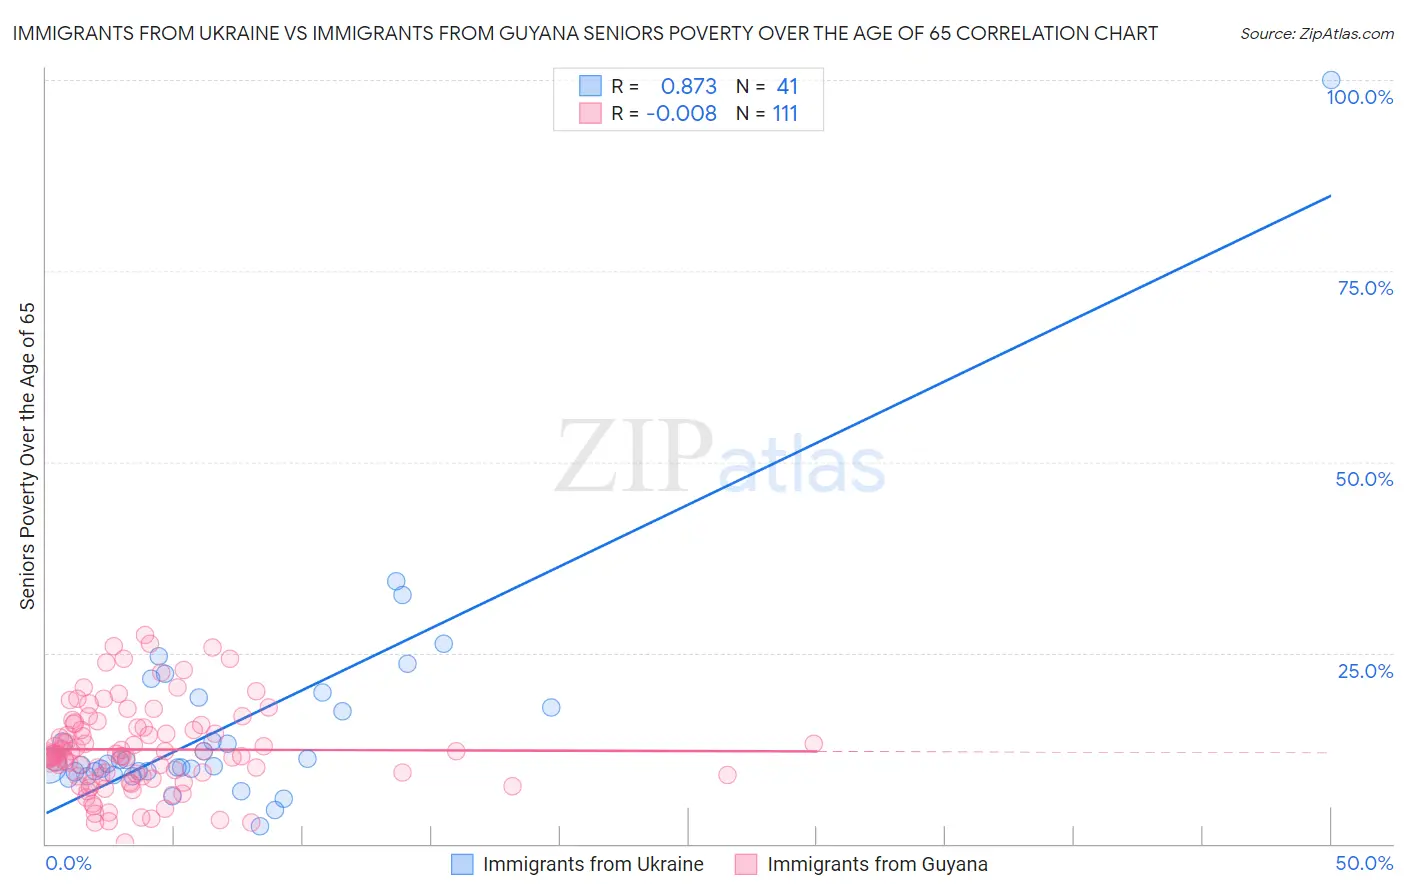
Immigrants from Ukraine vs Immigrants from Guyana Seniors Poverty Over the Age of 65 Correlation Chart
The statistical analysis conducted on geographies consisting of 288,944,558 people shows a very strong positive correlation between the proportion of Immigrants from Ukraine and poverty level among seniors over the age of 65 in the United States with a correlation coefficient (R) of 0.873 and weighted average of 11.6%. Similarly, the statistical analysis conducted on geographies consisting of 183,396,619 people shows no correlation between the proportion of Immigrants from Guyana and poverty level among seniors over the age of 65 in the United States with a correlation coefficient (R) of -0.008 and weighted average of 14.5%, a difference of 24.4%.
Seniors Poverty Over the Age of 65 Correlation Summary
| Measurement | Immigrants from Ukraine | Immigrants from Guyana |
| Minimum | 2.3% | 0.21% |
| Maximum | 100.0% | 27.3% |
| Range | 97.7% | 27.1% |
| Mean | 15.5% | 12.3% |
| Median | 10.5% | 11.7% |
| Interquartile 25% (IQ1) | 9.5% | 8.8% |
| Interquartile 75% (IQ3) | 18.5% | 15.2% |
| Interquartile Range (IQR) | 9.0% | 6.4% |
| Standard Deviation (Sample) | 15.3% | 5.7% |
| Standard Deviation (Population) | 15.1% | 5.6% |
Similar Demographics by Seniors Poverty Over the Age of 65
Demographics Similar to Immigrants from Ukraine by Seniors Poverty Over the Age of 65
In terms of seniors poverty over the age of 65, the demographic groups most similar to Immigrants from Ukraine are Arapaho (11.6%, a difference of 0.18%), Immigrants from Africa (11.6%, a difference of 0.27%), Immigrants from Morocco (11.6%, a difference of 0.41%), Peruvian (11.7%, a difference of 0.66%), and Argentinean (11.7%, a difference of 0.72%).
| Demographics | Rating | Rank | Seniors Poverty Over the Age of 65 |
| Indonesians | 10.4 /100 | #211 | Poor 11.5% |
| Immigrants | China | 9.5 /100 | #212 | Tragic 11.5% |
| Nepalese | 8.9 /100 | #213 | Tragic 11.5% |
| Immigrants | Russia | 8.8 /100 | #214 | Tragic 11.5% |
| French American Indians | 8.7 /100 | #215 | Tragic 11.5% |
| Immigrants | Morocco | 6.8 /100 | #216 | Tragic 11.6% |
| Immigrants | Africa | 6.4 /100 | #217 | Tragic 11.6% |
| Immigrants | Ukraine | 5.7 /100 | #218 | Tragic 11.6% |
| Arapaho | 5.2 /100 | #219 | Tragic 11.6% |
| Peruvians | 4.2 /100 | #220 | Tragic 11.7% |
| Argentineans | 4.1 /100 | #221 | Tragic 11.7% |
| Immigrants | Chile | 3.9 /100 | #222 | Tragic 11.7% |
| Immigrants | Congo | 3.8 /100 | #223 | Tragic 11.7% |
| Immigrants | Nigeria | 3.4 /100 | #224 | Tragic 11.7% |
| Immigrants | Belarus | 3.2 /100 | #225 | Tragic 11.8% |
Demographics Similar to Immigrants from Guyana by Seniors Poverty Over the Age of 65
In terms of seniors poverty over the age of 65, the demographic groups most similar to Immigrants from Guyana are Haitian (14.5%, a difference of 0.030%), Immigrants from Ecuador (14.4%, a difference of 0.21%), Guyanese (14.4%, a difference of 0.24%), Immigrants from Honduras (14.5%, a difference of 0.24%), and Barbadian (14.4%, a difference of 0.64%).
| Demographics | Rating | Rank | Seniors Poverty Over the Age of 65 |
| Hondurans | 0.0 /100 | #309 | Tragic 14.2% |
| Bahamians | 0.0 /100 | #310 | Tragic 14.2% |
| Natives/Alaskans | 0.0 /100 | #311 | Tragic 14.2% |
| Hispanics or Latinos | 0.0 /100 | #312 | Tragic 14.3% |
| Barbadians | 0.0 /100 | #313 | Tragic 14.4% |
| Guyanese | 0.0 /100 | #314 | Tragic 14.4% |
| Immigrants | Ecuador | 0.0 /100 | #315 | Tragic 14.4% |
| Immigrants | Guyana | 0.0 /100 | #316 | Tragic 14.5% |
| Haitians | 0.0 /100 | #317 | Tragic 14.5% |
| Immigrants | Honduras | 0.0 /100 | #318 | Tragic 14.5% |
| Cape Verdeans | 0.0 /100 | #319 | Tragic 14.7% |
| Immigrants | Haiti | 0.0 /100 | #320 | Tragic 14.7% |
| Houma | 0.0 /100 | #321 | Tragic 14.7% |
| Immigrants | Barbados | 0.0 /100 | #322 | Tragic 14.8% |
| Yakama | 0.0 /100 | #323 | Tragic 14.8% |