Taiwanese vs Immigrants from Czechoslovakia Female Poverty
COMPARE
Taiwanese
Immigrants from Czechoslovakia
Female Poverty
Female Poverty Comparison
Taiwanese
Immigrants from Czechoslovakia
13.1%
FEMALE POVERTY
75.7/ 100
METRIC RATING
149th/ 347
METRIC RANK
11.9%
FEMALE POVERTY
99.2/ 100
METRIC RATING
45th/ 347
METRIC RANK
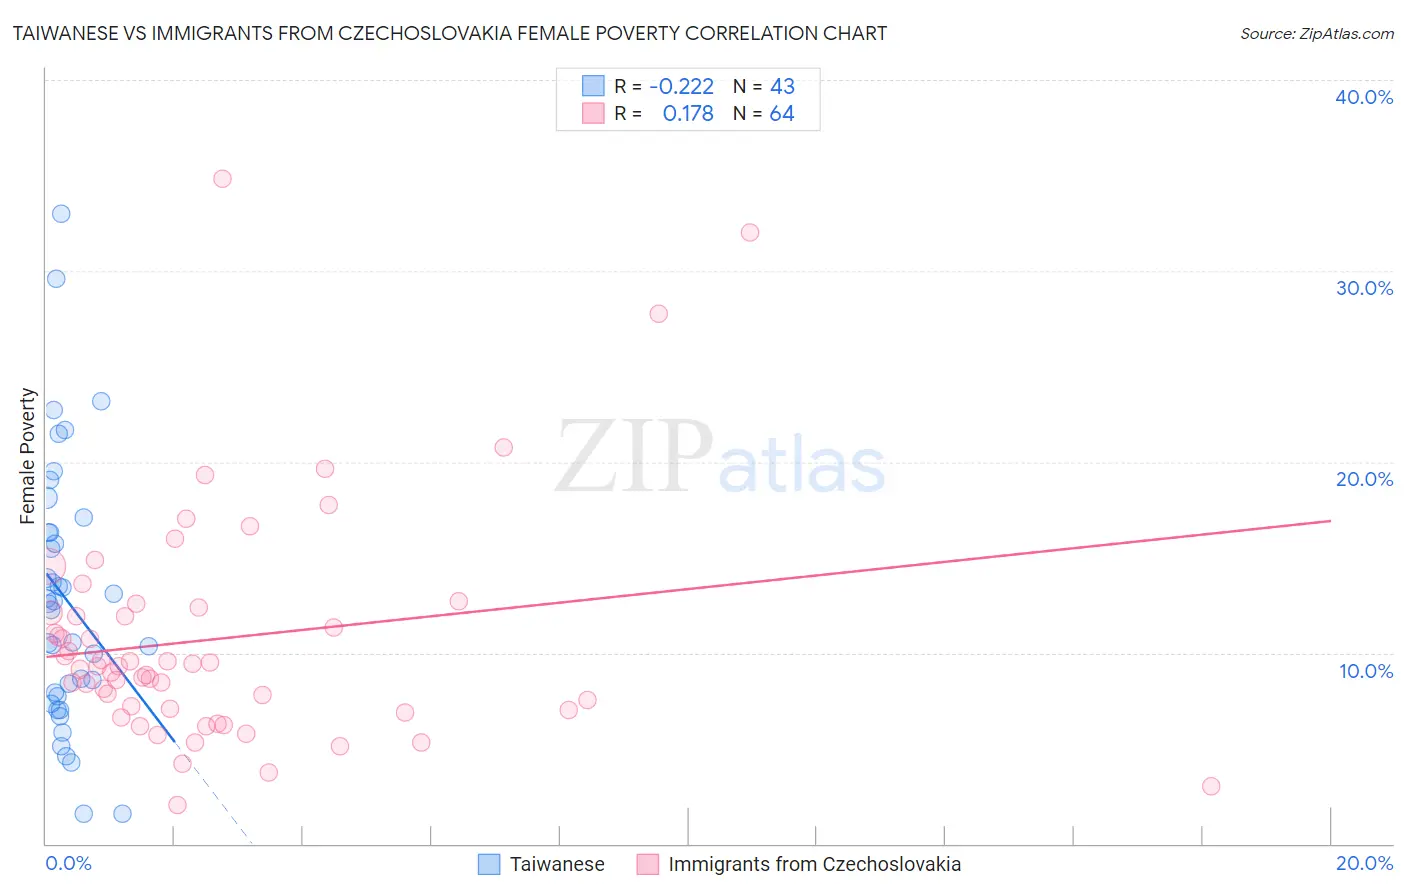
Taiwanese vs Immigrants from Czechoslovakia Female Poverty Correlation Chart
The statistical analysis conducted on geographies consisting of 31,695,393 people shows a weak negative correlation between the proportion of Taiwanese and poverty level among females in the United States with a correlation coefficient (R) of -0.222 and weighted average of 13.1%. Similarly, the statistical analysis conducted on geographies consisting of 195,448,057 people shows a poor positive correlation between the proportion of Immigrants from Czechoslovakia and poverty level among females in the United States with a correlation coefficient (R) of 0.178 and weighted average of 11.9%, a difference of 9.9%.
Female Poverty Correlation Summary
| Measurement | Taiwanese | Immigrants from Czechoslovakia |
| Minimum | 1.6% | 2.0% |
| Maximum | 33.0% | 34.9% |
| Range | 31.4% | 32.8% |
| Mean | 12.8% | 10.7% |
| Median | 12.6% | 9.3% |
| Interquartile 25% (IQ1) | 7.7% | 7.0% |
| Interquartile 75% (IQ3) | 16.3% | 12.2% |
| Interquartile Range (IQR) | 8.6% | 5.2% |
| Standard Deviation (Sample) | 6.9% | 6.2% |
| Standard Deviation (Population) | 6.8% | 6.1% |
Similar Demographics by Female Poverty
Demographics Similar to Taiwanese by Female Poverty
In terms of female poverty, the demographic groups most similar to Taiwanese are Tsimshian (13.1%, a difference of 0.030%), Immigrants from Germany (13.1%, a difference of 0.10%), Yugoslavian (13.1%, a difference of 0.16%), Samoan (13.1%, a difference of 0.27%), and Immigrants from Kazakhstan (13.0%, a difference of 0.41%).
| Demographics | Rating | Rank | Female Poverty |
| Brazilians | 80.5 /100 | #142 | Excellent 13.0% |
| Immigrants | Malaysia | 80.4 /100 | #143 | Excellent 13.0% |
| Afghans | 79.8 /100 | #144 | Good 13.0% |
| Syrians | 79.6 /100 | #145 | Good 13.0% |
| Immigrants | Peru | 79.1 /100 | #146 | Good 13.0% |
| Immigrants | Kazakhstan | 78.6 /100 | #147 | Good 13.0% |
| Yugoslavians | 76.9 /100 | #148 | Good 13.1% |
| Taiwanese | 75.7 /100 | #149 | Good 13.1% |
| Tsimshian | 75.5 /100 | #150 | Good 13.1% |
| Immigrants | Germany | 74.9 /100 | #151 | Good 13.1% |
| Samoans | 73.6 /100 | #152 | Good 13.1% |
| Immigrants | Fiji | 71.0 /100 | #153 | Good 13.2% |
| Armenians | 70.4 /100 | #154 | Good 13.2% |
| Hungarians | 70.1 /100 | #155 | Good 13.2% |
| Immigrants | Bosnia and Herzegovina | 69.7 /100 | #156 | Good 13.2% |
Demographics Similar to Immigrants from Czechoslovakia by Female Poverty
In terms of female poverty, the demographic groups most similar to Immigrants from Czechoslovakia are Turkish (11.9%, a difference of 0.0%), Tongan (11.9%, a difference of 0.090%), Korean (11.9%, a difference of 0.16%), Czech (11.9%, a difference of 0.20%), and Immigrants from Moldova (11.9%, a difference of 0.20%).
| Demographics | Rating | Rank | Female Poverty |
| Russians | 99.3 /100 | #38 | Exceptional 11.8% |
| Immigrants | Poland | 99.3 /100 | #39 | Exceptional 11.8% |
| Macedonians | 99.3 /100 | #40 | Exceptional 11.8% |
| Czechs | 99.2 /100 | #41 | Exceptional 11.9% |
| Immigrants | Moldova | 99.2 /100 | #42 | Exceptional 11.9% |
| Koreans | 99.2 /100 | #43 | Exceptional 11.9% |
| Tongans | 99.2 /100 | #44 | Exceptional 11.9% |
| Immigrants | Czechoslovakia | 99.2 /100 | #45 | Exceptional 11.9% |
| Turks | 99.2 /100 | #46 | Exceptional 11.9% |
| Asians | 99.1 /100 | #47 | Exceptional 11.9% |
| Immigrants | Japan | 99.0 /100 | #48 | Exceptional 11.9% |
| Immigrants | Romania | 99.0 /100 | #49 | Exceptional 12.0% |
| Slovenes | 98.9 /100 | #50 | Exceptional 12.0% |
| Immigrants | Bulgaria | 98.9 /100 | #51 | Exceptional 12.0% |
| Immigrants | Croatia | 98.7 /100 | #52 | Exceptional 12.0% |