Thai vs Immigrants from Czechoslovakia Female Poverty
COMPARE
Thai
Immigrants from Czechoslovakia
Female Poverty
Female Poverty Comparison
Thais
Immigrants from Czechoslovakia
10.5%
FEMALE POVERTY
100.0/ 100
METRIC RATING
3rd/ 347
METRIC RANK
11.9%
FEMALE POVERTY
99.2/ 100
METRIC RATING
45th/ 347
METRIC RANK
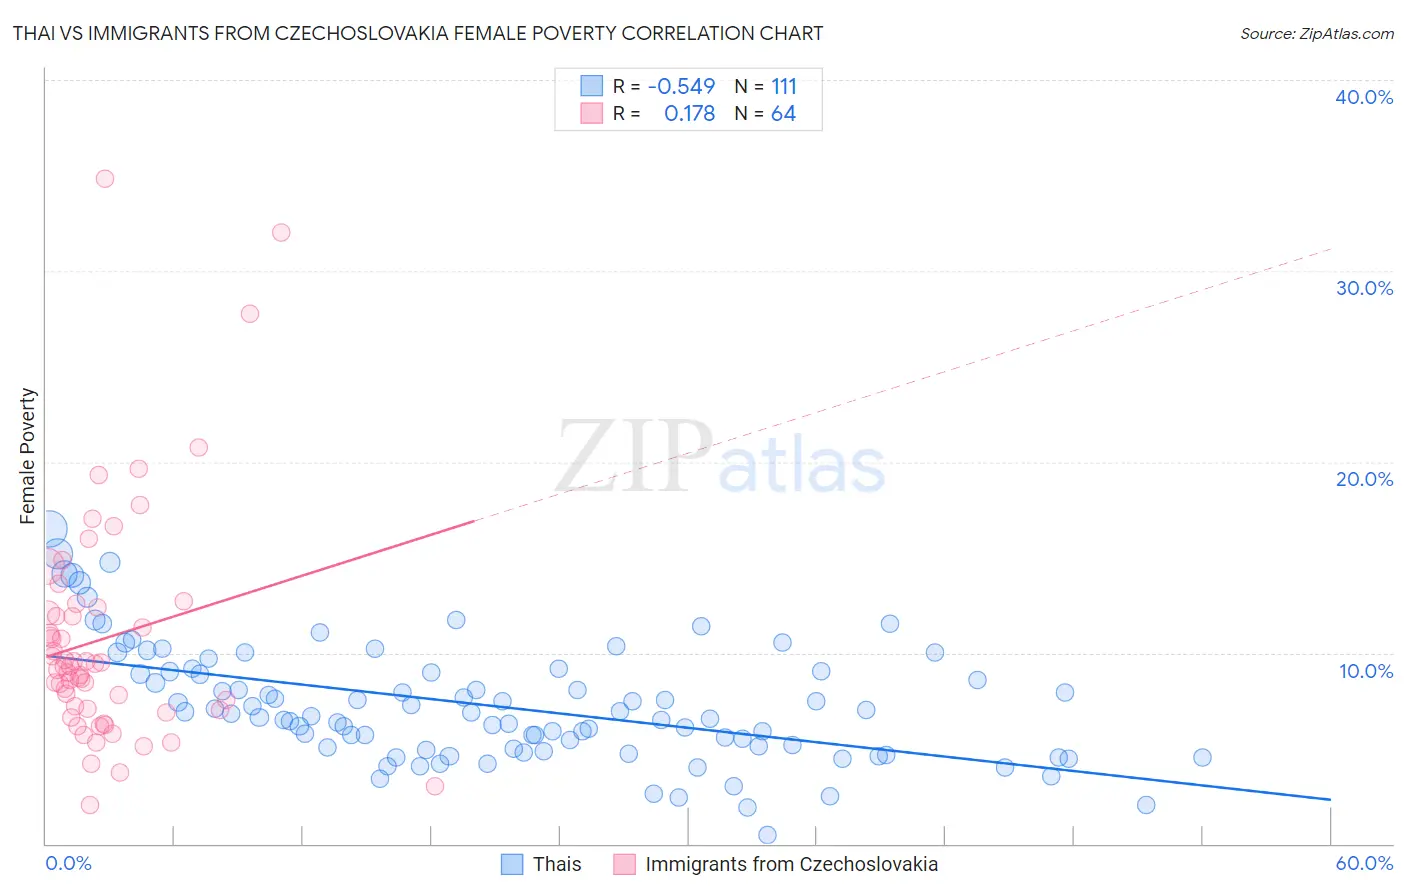
Thai vs Immigrants from Czechoslovakia Female Poverty Correlation Chart
The statistical analysis conducted on geographies consisting of 475,222,247 people shows a substantial negative correlation between the proportion of Thais and poverty level among females in the United States with a correlation coefficient (R) of -0.549 and weighted average of 10.5%. Similarly, the statistical analysis conducted on geographies consisting of 195,448,057 people shows a poor positive correlation between the proportion of Immigrants from Czechoslovakia and poverty level among females in the United States with a correlation coefficient (R) of 0.178 and weighted average of 11.9%, a difference of 13.8%.
Female Poverty Correlation Summary
| Measurement | Thai | Immigrants from Czechoslovakia |
| Minimum | 0.46% | 2.0% |
| Maximum | 16.5% | 34.9% |
| Range | 16.0% | 32.8% |
| Mean | 7.2% | 10.7% |
| Median | 6.8% | 9.3% |
| Interquartile 25% (IQ1) | 5.0% | 7.0% |
| Interquartile 75% (IQ3) | 9.0% | 12.2% |
| Interquartile Range (IQR) | 4.0% | 5.2% |
| Standard Deviation (Sample) | 3.1% | 6.2% |
| Standard Deviation (Population) | 3.0% | 6.1% |
Similar Demographics by Female Poverty
Demographics Similar to Thais by Female Poverty
In terms of female poverty, the demographic groups most similar to Thais are Chinese (10.4%, a difference of 0.65%), Immigrants from Taiwan (10.5%, a difference of 0.76%), Filipino (10.9%, a difference of 4.7%), Immigrants from Ireland (11.0%, a difference of 5.1%), and Assyrian/Chaldean/Syriac (11.0%, a difference of 5.5%).
| Demographics | Rating | Rank | Female Poverty |
| Immigrants | India | 100.0 /100 | #1 | Exceptional 9.9% |
| Chinese | 100.0 /100 | #2 | Exceptional 10.4% |
| Thais | 100.0 /100 | #3 | Exceptional 10.5% |
| Immigrants | Taiwan | 100.0 /100 | #4 | Exceptional 10.5% |
| Filipinos | 100.0 /100 | #5 | Exceptional 10.9% |
| Immigrants | Ireland | 99.9 /100 | #6 | Exceptional 11.0% |
| Assyrians/Chaldeans/Syriacs | 99.9 /100 | #7 | Exceptional 11.0% |
| Immigrants | South Central Asia | 99.9 /100 | #8 | Exceptional 11.1% |
| Bulgarians | 99.9 /100 | #9 | Exceptional 11.1% |
| Immigrants | Hong Kong | 99.9 /100 | #10 | Exceptional 11.2% |
| Maltese | 99.9 /100 | #11 | Exceptional 11.2% |
| Bhutanese | 99.9 /100 | #12 | Exceptional 11.3% |
| Immigrants | Lithuania | 99.9 /100 | #13 | Exceptional 11.3% |
| Lithuanians | 99.8 /100 | #14 | Exceptional 11.4% |
| Latvians | 99.8 /100 | #15 | Exceptional 11.4% |
Demographics Similar to Immigrants from Czechoslovakia by Female Poverty
In terms of female poverty, the demographic groups most similar to Immigrants from Czechoslovakia are Turkish (11.9%, a difference of 0.0%), Tongan (11.9%, a difference of 0.090%), Korean (11.9%, a difference of 0.16%), Czech (11.9%, a difference of 0.20%), and Immigrants from Moldova (11.9%, a difference of 0.20%).
| Demographics | Rating | Rank | Female Poverty |
| Russians | 99.3 /100 | #38 | Exceptional 11.8% |
| Immigrants | Poland | 99.3 /100 | #39 | Exceptional 11.8% |
| Macedonians | 99.3 /100 | #40 | Exceptional 11.8% |
| Czechs | 99.2 /100 | #41 | Exceptional 11.9% |
| Immigrants | Moldova | 99.2 /100 | #42 | Exceptional 11.9% |
| Koreans | 99.2 /100 | #43 | Exceptional 11.9% |
| Tongans | 99.2 /100 | #44 | Exceptional 11.9% |
| Immigrants | Czechoslovakia | 99.2 /100 | #45 | Exceptional 11.9% |
| Turks | 99.2 /100 | #46 | Exceptional 11.9% |
| Asians | 99.1 /100 | #47 | Exceptional 11.9% |
| Immigrants | Japan | 99.0 /100 | #48 | Exceptional 11.9% |
| Immigrants | Romania | 99.0 /100 | #49 | Exceptional 12.0% |
| Slovenes | 98.9 /100 | #50 | Exceptional 12.0% |
| Immigrants | Bulgaria | 98.9 /100 | #51 | Exceptional 12.0% |
| Immigrants | Croatia | 98.7 /100 | #52 | Exceptional 12.0% |