Somali vs Ugandan Child Poverty Under the Age of 5
COMPARE
Somali
Ugandan
Child Poverty Under the Age of 5
Child Poverty Under the Age of 5 Comparison
Somalis
Ugandans
21.1%
CHILD POVERTY UNDER THE AGE OF 5
0.0/ 100
METRIC RATING
284th/ 347
METRIC RANK
18.0%
CHILD POVERTY UNDER THE AGE OF 5
13.9/ 100
METRIC RATING
201st/ 347
METRIC RANK
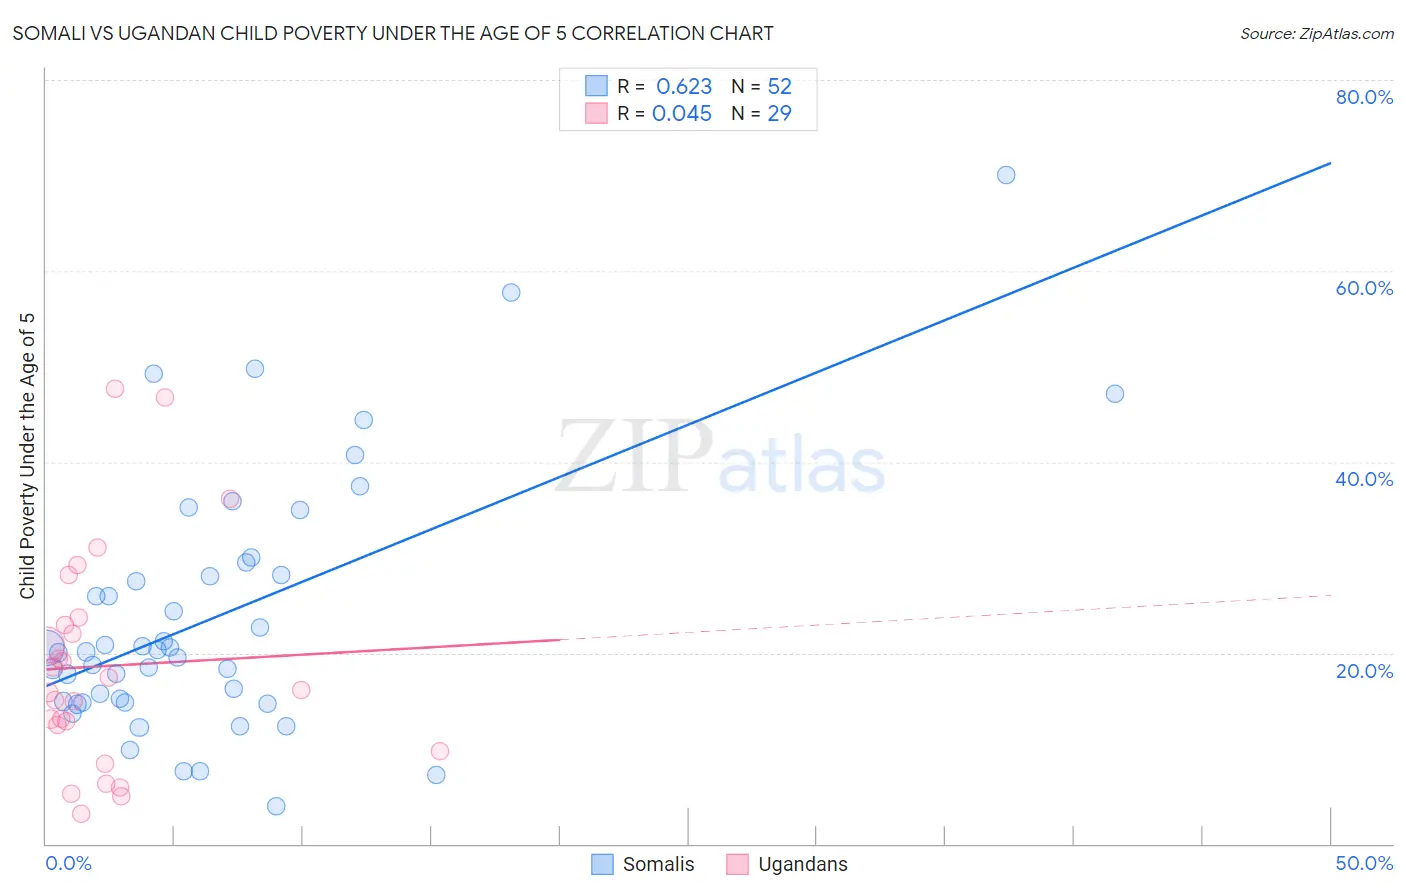
Somali vs Ugandan Child Poverty Under the Age of 5 Correlation Chart
The statistical analysis conducted on geographies consisting of 98,642,642 people shows a significant positive correlation between the proportion of Somalis and poverty level among children under the age of 5 in the United States with a correlation coefficient (R) of 0.623 and weighted average of 21.1%. Similarly, the statistical analysis conducted on geographies consisting of 92,908,510 people shows no correlation between the proportion of Ugandans and poverty level among children under the age of 5 in the United States with a correlation coefficient (R) of 0.045 and weighted average of 18.0%, a difference of 17.0%.
Child Poverty Under the Age of 5 Correlation Summary
| Measurement | Somali | Ugandan |
| Minimum | 3.9% | 3.2% |
| Maximum | 70.0% | 47.7% |
| Range | 66.1% | 44.5% |
| Mean | 23.9% | 18.6% |
| Median | 20.2% | 16.0% |
| Interquartile 25% (IQ1) | 14.9% | 11.1% |
| Interquartile 75% (IQ3) | 28.8% | 23.3% |
| Interquartile Range (IQR) | 13.9% | 12.2% |
| Standard Deviation (Sample) | 13.6% | 11.4% |
| Standard Deviation (Population) | 13.4% | 11.2% |
Similar Demographics by Child Poverty Under the Age of 5
Demographics Similar to Somalis by Child Poverty Under the Age of 5
In terms of child poverty under the age of 5, the demographic groups most similar to Somalis are Comanche (21.0%, a difference of 0.33%), Haitian (21.2%, a difference of 0.47%), Potawatomi (21.0%, a difference of 0.53%), Immigrants from Latin America (21.2%, a difference of 0.55%), and Immigrants from Zaire (21.3%, a difference of 0.64%).
| Demographics | Rating | Rank | Child Poverty Under the Age of 5 |
| Immigrants | West Indies | 0.0 /100 | #277 | Tragic 20.7% |
| Immigrants | Grenada | 0.0 /100 | #278 | Tragic 20.7% |
| Sub-Saharan Africans | 0.0 /100 | #279 | Tragic 20.8% |
| French American Indians | 0.0 /100 | #280 | Tragic 20.8% |
| Senegalese | 0.0 /100 | #281 | Tragic 20.9% |
| Potawatomi | 0.0 /100 | #282 | Tragic 21.0% |
| Comanche | 0.0 /100 | #283 | Tragic 21.0% |
| Somalis | 0.0 /100 | #284 | Tragic 21.1% |
| Haitians | 0.0 /100 | #285 | Tragic 21.2% |
| Immigrants | Latin America | 0.0 /100 | #286 | Tragic 21.2% |
| Immigrants | Zaire | 0.0 /100 | #287 | Tragic 21.3% |
| Immigrants | Senegal | 0.0 /100 | #288 | Tragic 21.3% |
| Immigrants | Haiti | 0.0 /100 | #289 | Tragic 21.3% |
| Immigrants | Caribbean | 0.0 /100 | #290 | Tragic 21.4% |
| British West Indians | 0.0 /100 | #291 | Tragic 21.4% |
Demographics Similar to Ugandans by Child Poverty Under the Age of 5
In terms of child poverty under the age of 5, the demographic groups most similar to Ugandans are Iraqi (18.0%, a difference of 0.010%), Japanese (18.1%, a difference of 0.020%), Immigrants from Cambodia (18.1%, a difference of 0.040%), Immigrants from Eastern Africa (18.1%, a difference of 0.090%), and Spaniard (18.1%, a difference of 0.22%).
| Demographics | Rating | Rank | Child Poverty Under the Age of 5 |
| French Canadians | 24.6 /100 | #194 | Fair 17.7% |
| Sierra Leoneans | 24.1 /100 | #195 | Fair 17.7% |
| Immigrants | Portugal | 22.2 /100 | #196 | Fair 17.8% |
| Immigrants | Kenya | 20.0 /100 | #197 | Fair 17.9% |
| Celtics | 18.3 /100 | #198 | Poor 17.9% |
| Hungarians | 18.3 /100 | #199 | Poor 17.9% |
| Iraqis | 14.0 /100 | #200 | Poor 18.0% |
| Ugandans | 13.9 /100 | #201 | Poor 18.0% |
| Japanese | 13.8 /100 | #202 | Poor 18.1% |
| Immigrants | Cambodia | 13.7 /100 | #203 | Poor 18.1% |
| Immigrants | Eastern Africa | 13.4 /100 | #204 | Poor 18.1% |
| Spaniards | 12.8 /100 | #205 | Poor 18.1% |
| Whites/Caucasians | 12.6 /100 | #206 | Poor 18.1% |
| Immigrants | Immigrants | 9.9 /100 | #207 | Tragic 18.2% |
| Scotch-Irish | 9.8 /100 | #208 | Tragic 18.2% |