Immigrants from Kuwait vs Ugandan Child Poverty Under the Age of 5
COMPARE
Immigrants from Kuwait
Ugandan
Child Poverty Under the Age of 5
Child Poverty Under the Age of 5 Comparison
Immigrants from Kuwait
Ugandans
16.0%
CHILD POVERTY UNDER THE AGE OF 5
93.9/ 100
METRIC RATING
114th/ 347
METRIC RANK
18.0%
CHILD POVERTY UNDER THE AGE OF 5
13.9/ 100
METRIC RATING
201st/ 347
METRIC RANK
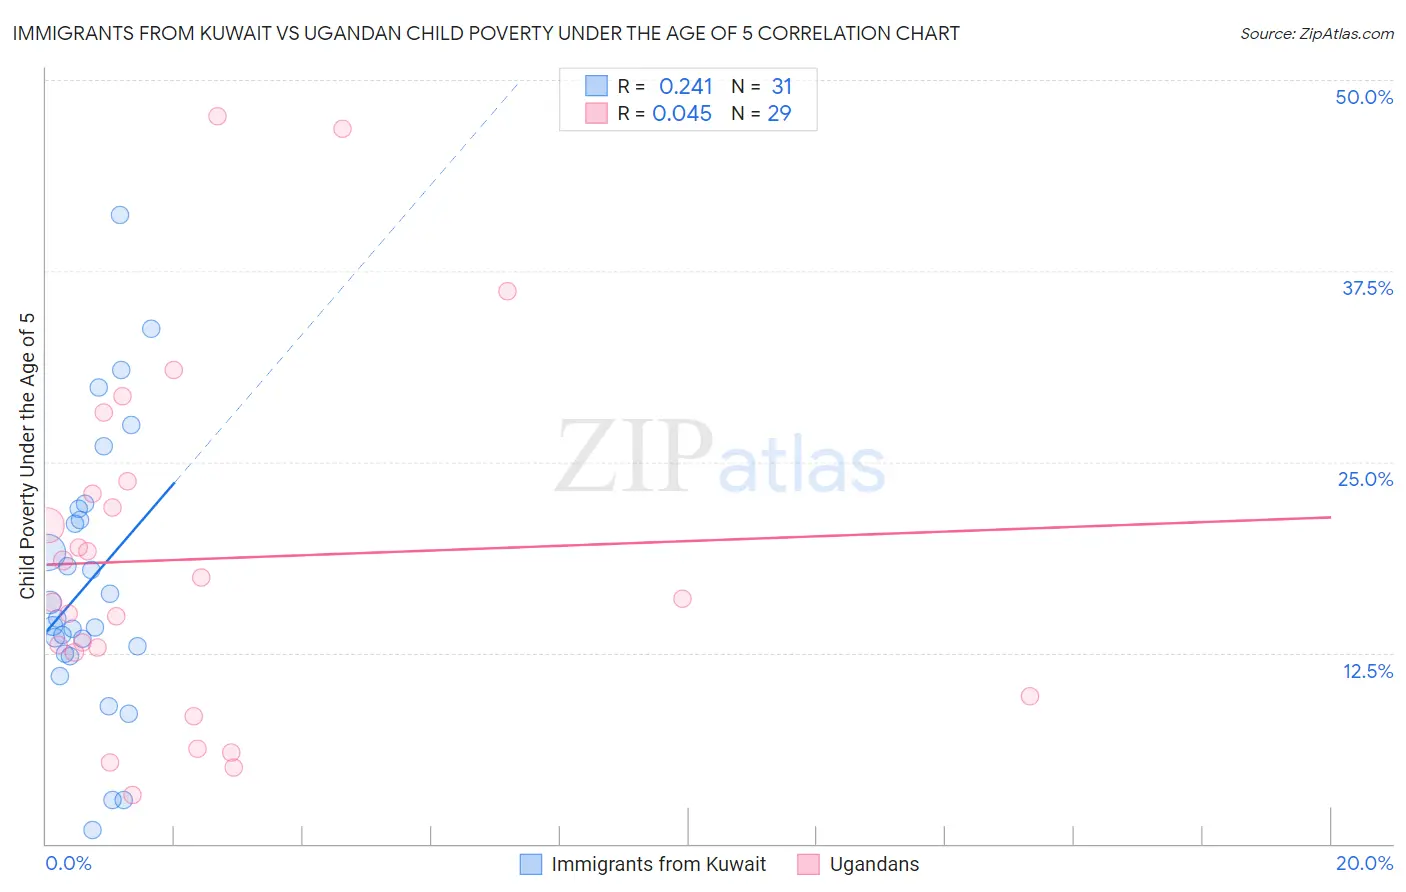
Immigrants from Kuwait vs Ugandan Child Poverty Under the Age of 5 Correlation Chart
The statistical analysis conducted on geographies consisting of 134,511,705 people shows a weak positive correlation between the proportion of Immigrants from Kuwait and poverty level among children under the age of 5 in the United States with a correlation coefficient (R) of 0.241 and weighted average of 16.0%. Similarly, the statistical analysis conducted on geographies consisting of 92,908,510 people shows no correlation between the proportion of Ugandans and poverty level among children under the age of 5 in the United States with a correlation coefficient (R) of 0.045 and weighted average of 18.0%, a difference of 12.7%.
Child Poverty Under the Age of 5 Correlation Summary
| Measurement | Immigrants from Kuwait | Ugandan |
| Minimum | 0.87% | 3.2% |
| Maximum | 41.2% | 47.7% |
| Range | 40.3% | 44.5% |
| Mean | 17.2% | 18.6% |
| Median | 14.7% | 16.0% |
| Interquartile 25% (IQ1) | 12.4% | 11.1% |
| Interquartile 75% (IQ3) | 22.0% | 23.3% |
| Interquartile Range (IQR) | 9.5% | 12.2% |
| Standard Deviation (Sample) | 9.1% | 11.4% |
| Standard Deviation (Population) | 8.9% | 11.2% |
Similar Demographics by Child Poverty Under the Age of 5
Demographics Similar to Immigrants from Kuwait by Child Poverty Under the Age of 5
In terms of child poverty under the age of 5, the demographic groups most similar to Immigrants from Kuwait are Albanian (16.0%, a difference of 0.020%), Peruvian (16.0%, a difference of 0.090%), Puget Sound Salish (16.0%, a difference of 0.090%), Pakistani (16.0%, a difference of 0.15%), and Romanian (16.0%, a difference of 0.18%).
| Demographics | Rating | Rank | Child Poverty Under the Age of 5 |
| Slovenes | 94.4 /100 | #107 | Exceptional 16.0% |
| Immigrants | Brazil | 94.4 /100 | #108 | Exceptional 16.0% |
| Northern Europeans | 94.3 /100 | #109 | Exceptional 16.0% |
| Romanians | 94.3 /100 | #110 | Exceptional 16.0% |
| Pakistanis | 94.2 /100 | #111 | Exceptional 16.0% |
| Peruvians | 94.1 /100 | #112 | Exceptional 16.0% |
| Puget Sound Salish | 94.1 /100 | #113 | Exceptional 16.0% |
| Immigrants | Kuwait | 93.9 /100 | #114 | Exceptional 16.0% |
| Albanians | 93.8 /100 | #115 | Exceptional 16.0% |
| Immigrants | Austria | 93.5 /100 | #116 | Exceptional 16.0% |
| Basques | 93.4 /100 | #117 | Exceptional 16.0% |
| Immigrants | Denmark | 93.4 /100 | #118 | Exceptional 16.0% |
| Immigrants | Jordan | 93.2 /100 | #119 | Exceptional 16.1% |
| Immigrants | Peru | 92.6 /100 | #120 | Exceptional 16.1% |
| Mongolians | 92.5 /100 | #121 | Exceptional 16.1% |
Demographics Similar to Ugandans by Child Poverty Under the Age of 5
In terms of child poverty under the age of 5, the demographic groups most similar to Ugandans are Iraqi (18.0%, a difference of 0.010%), Japanese (18.1%, a difference of 0.020%), Immigrants from Cambodia (18.1%, a difference of 0.040%), Immigrants from Eastern Africa (18.1%, a difference of 0.090%), and Spaniard (18.1%, a difference of 0.22%).
| Demographics | Rating | Rank | Child Poverty Under the Age of 5 |
| French Canadians | 24.6 /100 | #194 | Fair 17.7% |
| Sierra Leoneans | 24.1 /100 | #195 | Fair 17.7% |
| Immigrants | Portugal | 22.2 /100 | #196 | Fair 17.8% |
| Immigrants | Kenya | 20.0 /100 | #197 | Fair 17.9% |
| Celtics | 18.3 /100 | #198 | Poor 17.9% |
| Hungarians | 18.3 /100 | #199 | Poor 17.9% |
| Iraqis | 14.0 /100 | #200 | Poor 18.0% |
| Ugandans | 13.9 /100 | #201 | Poor 18.0% |
| Japanese | 13.8 /100 | #202 | Poor 18.1% |
| Immigrants | Cambodia | 13.7 /100 | #203 | Poor 18.1% |
| Immigrants | Eastern Africa | 13.4 /100 | #204 | Poor 18.1% |
| Spaniards | 12.8 /100 | #205 | Poor 18.1% |
| Whites/Caucasians | 12.6 /100 | #206 | Poor 18.1% |
| Immigrants | Immigrants | 9.9 /100 | #207 | Tragic 18.2% |
| Scotch-Irish | 9.8 /100 | #208 | Tragic 18.2% |