Syrian vs Immigrants from Laos Male Poverty
COMPARE
Syrian
Immigrants from Laos
Male Poverty
Male Poverty Comparison
Syrians
Immigrants from Laos
10.9%
MALE POVERTY
71.4/ 100
METRIC RATING
146th/ 347
METRIC RANK
12.6%
MALE POVERTY
0.5/ 100
METRIC RATING
235th/ 347
METRIC RANK
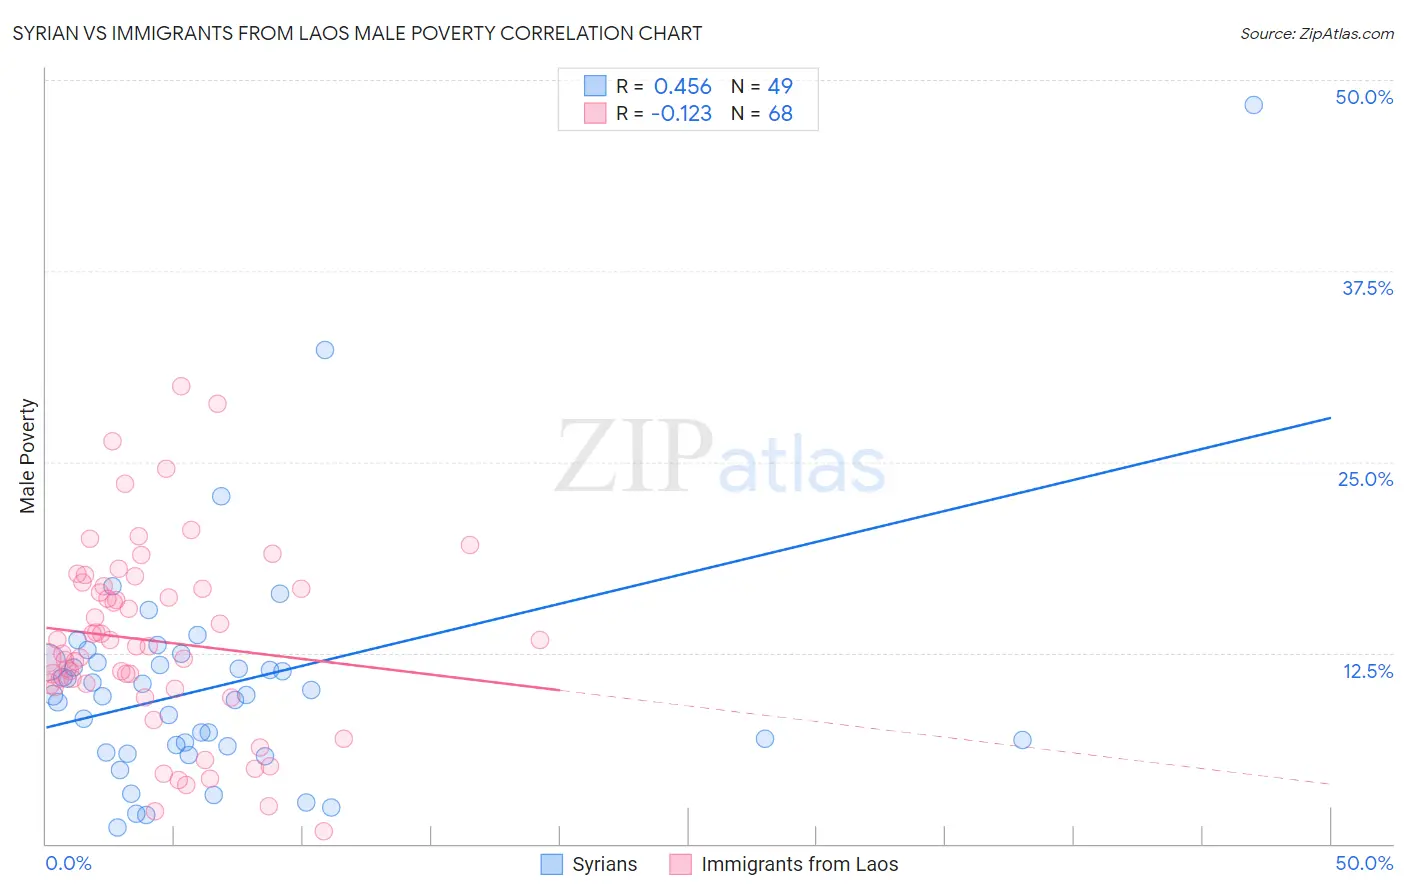
Syrian vs Immigrants from Laos Male Poverty Correlation Chart
The statistical analysis conducted on geographies consisting of 266,155,974 people shows a moderate positive correlation between the proportion of Syrians and poverty level among males in the United States with a correlation coefficient (R) of 0.456 and weighted average of 10.9%. Similarly, the statistical analysis conducted on geographies consisting of 201,450,990 people shows a poor negative correlation between the proportion of Immigrants from Laos and poverty level among males in the United States with a correlation coefficient (R) of -0.123 and weighted average of 12.6%, a difference of 15.6%.
Male Poverty Correlation Summary
| Measurement | Syrian | Immigrants from Laos |
| Minimum | 1.0% | 0.78% |
| Maximum | 48.3% | 29.9% |
| Range | 47.3% | 29.2% |
| Mean | 10.4% | 13.3% |
| Median | 9.7% | 12.9% |
| Interquartile 25% (IQ1) | 6.2% | 10.3% |
| Interquartile 75% (IQ3) | 11.8% | 16.8% |
| Interquartile Range (IQR) | 5.7% | 6.4% |
| Standard Deviation (Sample) | 7.8% | 6.1% |
| Standard Deviation (Population) | 7.7% | 6.1% |
Similar Demographics by Male Poverty
Demographics Similar to Syrians by Male Poverty
In terms of male poverty, the demographic groups most similar to Syrians are Immigrants from Germany (10.9%, a difference of 0.030%), Samoan (10.9%, a difference of 0.050%), Afghan (10.9%, a difference of 0.070%), Icelander (11.0%, a difference of 0.34%), and Armenian (11.0%, a difference of 0.40%).
| Demographics | Rating | Rank | Male Poverty |
| Immigrants | Jordan | 77.5 /100 | #139 | Good 10.8% |
| Tlingit-Haida | 76.1 /100 | #140 | Good 10.9% |
| Immigrants | France | 75.8 /100 | #141 | Good 10.9% |
| Basques | 74.6 /100 | #142 | Good 10.9% |
| Afghans | 71.9 /100 | #143 | Good 10.9% |
| Samoans | 71.8 /100 | #144 | Good 10.9% |
| Immigrants | Germany | 71.6 /100 | #145 | Good 10.9% |
| Syrians | 71.4 /100 | #146 | Good 10.9% |
| Icelanders | 68.5 /100 | #147 | Good 11.0% |
| Armenians | 68.0 /100 | #148 | Good 11.0% |
| Immigrants | Venezuela | 67.9 /100 | #149 | Good 11.0% |
| Guamanians/Chamorros | 67.6 /100 | #150 | Good 11.0% |
| Venezuelans | 67.4 /100 | #151 | Good 11.0% |
| Immigrants | Nepal | 67.3 /100 | #152 | Good 11.0% |
| Immigrants | Bosnia and Herzegovina | 65.2 /100 | #153 | Good 11.0% |
Demographics Similar to Immigrants from Laos by Male Poverty
In terms of male poverty, the demographic groups most similar to Immigrants from Laos are Immigrants from Saudi Arabia (12.7%, a difference of 0.25%), French American Indian (12.7%, a difference of 0.29%), Ecuadorian (12.7%, a difference of 0.32%), Ghanaian (12.7%, a difference of 0.33%), and Immigrants from Armenia (12.6%, a difference of 0.36%).
| Demographics | Rating | Rank | Male Poverty |
| Alsatians | 1.3 /100 | #228 | Tragic 12.4% |
| Cubans | 1.3 /100 | #229 | Tragic 12.4% |
| Marshallese | 0.8 /100 | #230 | Tragic 12.5% |
| Salvadorans | 0.6 /100 | #231 | Tragic 12.6% |
| Nicaraguans | 0.6 /100 | #232 | Tragic 12.6% |
| Fijians | 0.6 /100 | #233 | Tragic 12.6% |
| Immigrants | Armenia | 0.6 /100 | #234 | Tragic 12.6% |
| Immigrants | Laos | 0.5 /100 | #235 | Tragic 12.6% |
| Immigrants | Saudi Arabia | 0.4 /100 | #236 | Tragic 12.7% |
| French American Indians | 0.4 /100 | #237 | Tragic 12.7% |
| Ecuadorians | 0.4 /100 | #238 | Tragic 12.7% |
| Ghanaians | 0.4 /100 | #239 | Tragic 12.7% |
| Immigrants | Middle Africa | 0.4 /100 | #240 | Tragic 12.7% |
| Sudanese | 0.3 /100 | #241 | Tragic 12.8% |
| Nepalese | 0.3 /100 | #242 | Tragic 12.8% |