Syrian vs Nepalese Male Poverty
COMPARE
Syrian
Nepalese
Male Poverty
Male Poverty Comparison
Syrians
Nepalese
10.9%
MALE POVERTY
71.4/ 100
METRIC RATING
146th/ 347
METRIC RANK
12.8%
MALE POVERTY
0.3/ 100
METRIC RATING
242nd/ 347
METRIC RANK
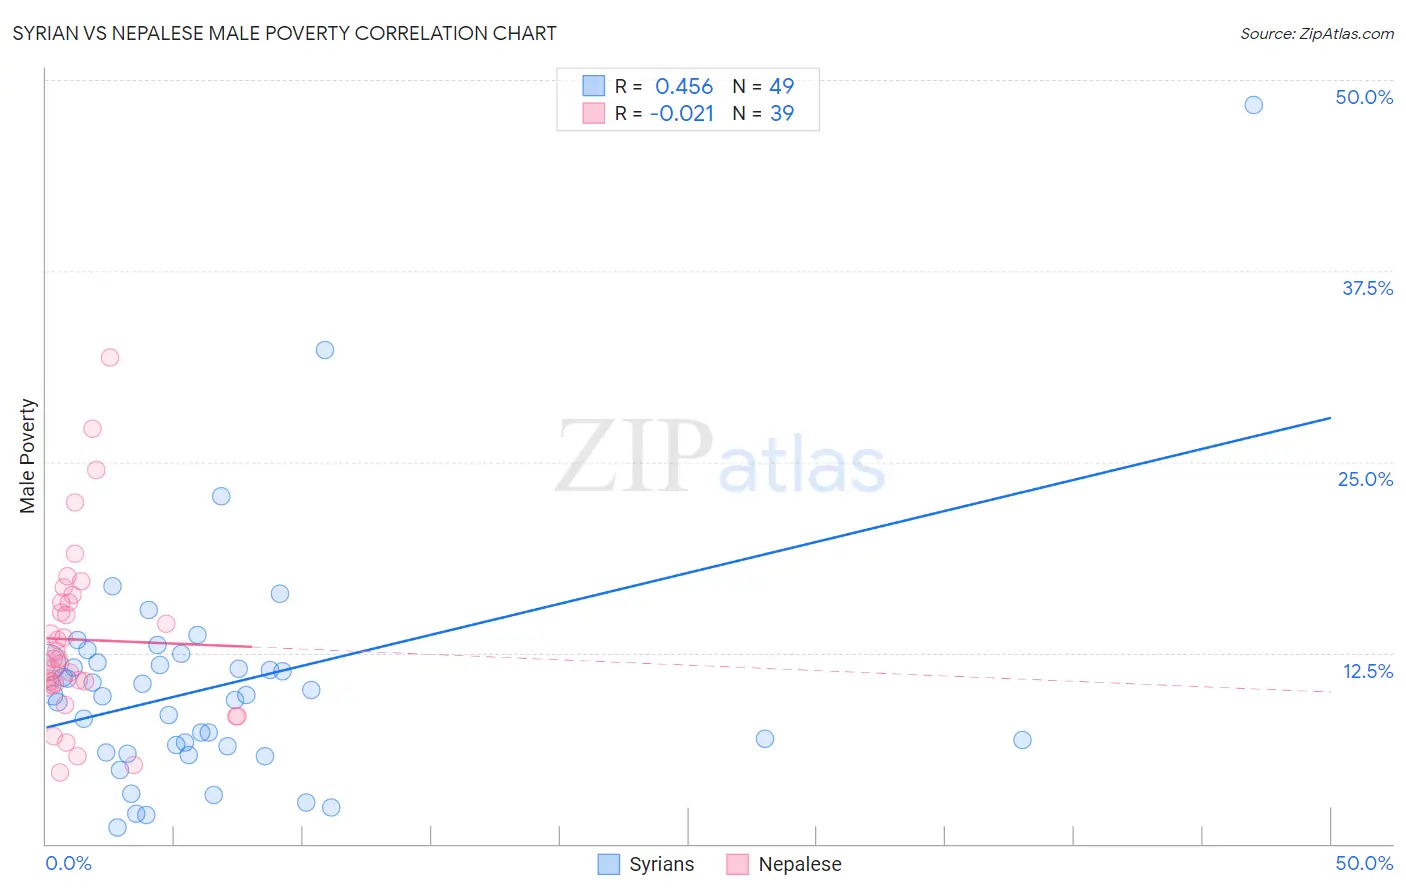
Syrian vs Nepalese Male Poverty Correlation Chart
The statistical analysis conducted on geographies consisting of 266,155,974 people shows a moderate positive correlation between the proportion of Syrians and poverty level among males in the United States with a correlation coefficient (R) of 0.456 and weighted average of 10.9%. Similarly, the statistical analysis conducted on geographies consisting of 24,519,269 people shows no correlation between the proportion of Nepalese and poverty level among males in the United States with a correlation coefficient (R) of -0.021 and weighted average of 12.8%, a difference of 16.9%.
Male Poverty Correlation Summary
| Measurement | Syrian | Nepalese |
| Minimum | 1.0% | 4.7% |
| Maximum | 48.3% | 31.9% |
| Range | 47.3% | 27.2% |
| Mean | 10.4% | 13.4% |
| Median | 9.7% | 12.1% |
| Interquartile 25% (IQ1) | 6.2% | 10.4% |
| Interquartile 75% (IQ3) | 11.8% | 15.8% |
| Interquartile Range (IQR) | 5.7% | 5.4% |
| Standard Deviation (Sample) | 7.8% | 5.8% |
| Standard Deviation (Population) | 7.7% | 5.7% |
Similar Demographics by Male Poverty
Demographics Similar to Syrians by Male Poverty
In terms of male poverty, the demographic groups most similar to Syrians are Immigrants from Germany (10.9%, a difference of 0.030%), Samoan (10.9%, a difference of 0.050%), Afghan (10.9%, a difference of 0.070%), Icelander (11.0%, a difference of 0.34%), and Armenian (11.0%, a difference of 0.40%).
| Demographics | Rating | Rank | Male Poverty |
| Immigrants | Jordan | 77.5 /100 | #139 | Good 10.8% |
| Tlingit-Haida | 76.1 /100 | #140 | Good 10.9% |
| Immigrants | France | 75.8 /100 | #141 | Good 10.9% |
| Basques | 74.6 /100 | #142 | Good 10.9% |
| Afghans | 71.9 /100 | #143 | Good 10.9% |
| Samoans | 71.8 /100 | #144 | Good 10.9% |
| Immigrants | Germany | 71.6 /100 | #145 | Good 10.9% |
| Syrians | 71.4 /100 | #146 | Good 10.9% |
| Icelanders | 68.5 /100 | #147 | Good 11.0% |
| Armenians | 68.0 /100 | #148 | Good 11.0% |
| Immigrants | Venezuela | 67.9 /100 | #149 | Good 11.0% |
| Guamanians/Chamorros | 67.6 /100 | #150 | Good 11.0% |
| Venezuelans | 67.4 /100 | #151 | Good 11.0% |
| Immigrants | Nepal | 67.3 /100 | #152 | Good 11.0% |
| Immigrants | Bosnia and Herzegovina | 65.2 /100 | #153 | Good 11.0% |
Demographics Similar to Nepalese by Male Poverty
In terms of male poverty, the demographic groups most similar to Nepalese are Alaskan Athabascan (12.8%, a difference of 0.040%), Tsimshian (12.8%, a difference of 0.14%), Liberian (12.8%, a difference of 0.16%), Sudanese (12.8%, a difference of 0.17%), and Immigrants from El Salvador (12.8%, a difference of 0.46%).
| Demographics | Rating | Rank | Male Poverty |
| Immigrants | Laos | 0.5 /100 | #235 | Tragic 12.6% |
| Immigrants | Saudi Arabia | 0.4 /100 | #236 | Tragic 12.7% |
| French American Indians | 0.4 /100 | #237 | Tragic 12.7% |
| Ecuadorians | 0.4 /100 | #238 | Tragic 12.7% |
| Ghanaians | 0.4 /100 | #239 | Tragic 12.7% |
| Immigrants | Middle Africa | 0.4 /100 | #240 | Tragic 12.7% |
| Sudanese | 0.3 /100 | #241 | Tragic 12.8% |
| Nepalese | 0.3 /100 | #242 | Tragic 12.8% |
| Alaskan Athabascans | 0.3 /100 | #243 | Tragic 12.8% |
| Tsimshian | 0.3 /100 | #244 | Tragic 12.8% |
| Liberians | 0.3 /100 | #245 | Tragic 12.8% |
| Immigrants | El Salvador | 0.2 /100 | #246 | Tragic 12.8% |
| Immigrants | Western Africa | 0.2 /100 | #247 | Tragic 12.9% |
| Immigrants | Sudan | 0.2 /100 | #248 | Tragic 12.9% |
| Potawatomi | 0.2 /100 | #249 | Tragic 12.9% |