Immigrants from Sudan vs Korean Child Poverty Under the Age of 5
COMPARE
Immigrants from Sudan
Korean
Child Poverty Under the Age of 5
Child Poverty Under the Age of 5 Comparison
Immigrants from Sudan
Koreans
19.2%
CHILD POVERTY UNDER THE AGE OF 5
1.3/ 100
METRIC RATING
228th/ 347
METRIC RANK
14.4%
CHILD POVERTY UNDER THE AGE OF 5
99.8/ 100
METRIC RATING
31st/ 347
METRIC RANK
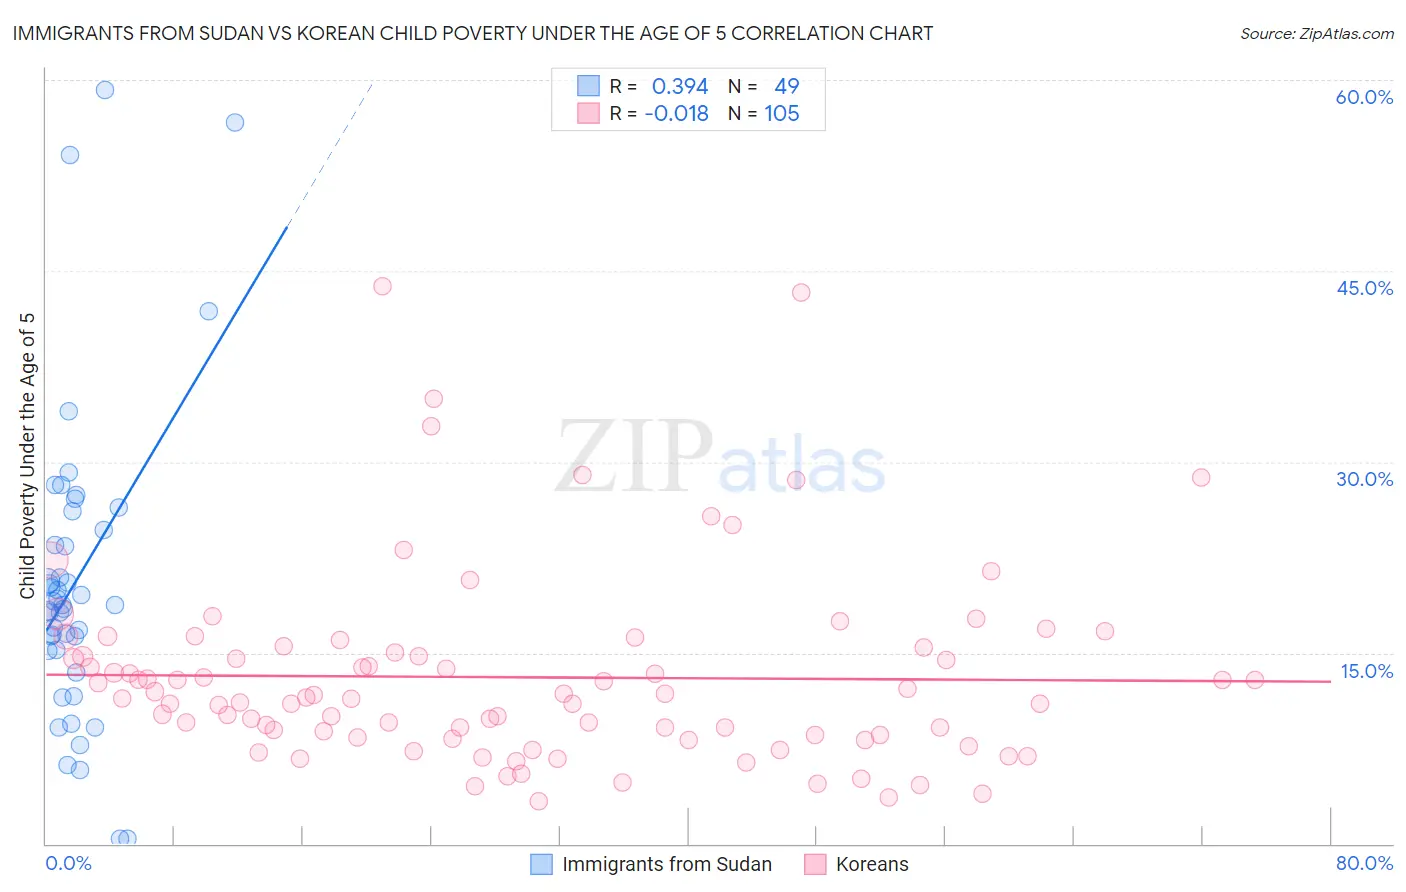
Immigrants from Sudan vs Korean Child Poverty Under the Age of 5 Correlation Chart
The statistical analysis conducted on geographies consisting of 117,972,836 people shows a mild positive correlation between the proportion of Immigrants from Sudan and poverty level among children under the age of 5 in the United States with a correlation coefficient (R) of 0.394 and weighted average of 19.2%. Similarly, the statistical analysis conducted on geographies consisting of 483,948,585 people shows no correlation between the proportion of Koreans and poverty level among children under the age of 5 in the United States with a correlation coefficient (R) of -0.018 and weighted average of 14.4%, a difference of 33.2%.
Child Poverty Under the Age of 5 Correlation Summary
| Measurement | Immigrants from Sudan | Korean |
| Minimum | 0.35% | 3.3% |
| Maximum | 59.2% | 43.8% |
| Range | 58.9% | 40.5% |
| Mean | 20.7% | 13.1% |
| Median | 18.8% | 11.4% |
| Interquartile 25% (IQ1) | 15.2% | 8.5% |
| Interquartile 75% (IQ3) | 25.4% | 15.2% |
| Interquartile Range (IQR) | 10.2% | 6.7% |
| Standard Deviation (Sample) | 12.2% | 7.5% |
| Standard Deviation (Population) | 12.1% | 7.5% |
Similar Demographics by Child Poverty Under the Age of 5
Demographics Similar to Immigrants from Sudan by Child Poverty Under the Age of 5
In terms of child poverty under the age of 5, the demographic groups most similar to Immigrants from Sudan are Ghanaian (19.2%, a difference of 0.080%), Ecuadorian (19.2%, a difference of 0.12%), Bermudan (19.2%, a difference of 0.17%), Cape Verdean (19.1%, a difference of 0.30%), and Immigrants from Eritrea (19.1%, a difference of 0.49%).
| Demographics | Rating | Rank | Child Poverty Under the Age of 5 |
| Immigrants | Nigeria | 2.1 /100 | #221 | Tragic 19.0% |
| Alsatians | 1.7 /100 | #222 | Tragic 19.1% |
| Cubans | 1.7 /100 | #223 | Tragic 19.1% |
| Nicaraguans | 1.6 /100 | #224 | Tragic 19.1% |
| Nigerians | 1.6 /100 | #225 | Tragic 19.1% |
| Immigrants | Eritrea | 1.5 /100 | #226 | Tragic 19.1% |
| Cape Verdeans | 1.4 /100 | #227 | Tragic 19.1% |
| Immigrants | Sudan | 1.3 /100 | #228 | Tragic 19.2% |
| Ghanaians | 1.2 /100 | #229 | Tragic 19.2% |
| Ecuadorians | 1.2 /100 | #230 | Tragic 19.2% |
| Bermudans | 1.2 /100 | #231 | Tragic 19.2% |
| Trinidadians and Tobagonians | 0.9 /100 | #232 | Tragic 19.3% |
| Sudanese | 0.9 /100 | #233 | Tragic 19.3% |
| Immigrants | Micronesia | 0.9 /100 | #234 | Tragic 19.4% |
| Immigrants | Laos | 0.8 /100 | #235 | Tragic 19.4% |
Demographics Similar to Koreans by Child Poverty Under the Age of 5
In terms of child poverty under the age of 5, the demographic groups most similar to Koreans are Cambodian (14.4%, a difference of 0.030%), Immigrants from Asia (14.4%, a difference of 0.080%), Immigrants from Sri Lanka (14.4%, a difference of 0.28%), Immigrants from Indonesia (14.3%, a difference of 0.47%), and Taiwanese (14.5%, a difference of 0.58%).
| Demographics | Rating | Rank | Child Poverty Under the Age of 5 |
| Asians | 99.9 /100 | #24 | Exceptional 14.0% |
| Cypriots | 99.9 /100 | #25 | Exceptional 14.0% |
| Immigrants | Lithuania | 99.9 /100 | #26 | Exceptional 14.1% |
| Tongans | 99.9 /100 | #27 | Exceptional 14.2% |
| Immigrants | Indonesia | 99.8 /100 | #28 | Exceptional 14.3% |
| Immigrants | Asia | 99.8 /100 | #29 | Exceptional 14.4% |
| Cambodians | 99.8 /100 | #30 | Exceptional 14.4% |
| Koreans | 99.8 /100 | #31 | Exceptional 14.4% |
| Immigrants | Sri Lanka | 99.8 /100 | #32 | Exceptional 14.4% |
| Taiwanese | 99.8 /100 | #33 | Exceptional 14.5% |
| Immigrants | Moldova | 99.8 /100 | #34 | Exceptional 14.5% |
| Latvians | 99.8 /100 | #35 | Exceptional 14.5% |
| Maltese | 99.8 /100 | #36 | Exceptional 14.5% |
| Turks | 99.7 /100 | #37 | Exceptional 14.6% |
| Eastern Europeans | 99.7 /100 | #38 | Exceptional 14.6% |