Honduran vs Korean Child Poverty Under the Age of 5
COMPARE
Honduran
Korean
Child Poverty Under the Age of 5
Child Poverty Under the Age of 5 Comparison
Hondurans
Koreans
23.0%
CHILD POVERTY UNDER THE AGE OF 5
0.0/ 100
METRIC RATING
312th/ 347
METRIC RANK
14.4%
CHILD POVERTY UNDER THE AGE OF 5
99.8/ 100
METRIC RATING
31st/ 347
METRIC RANK
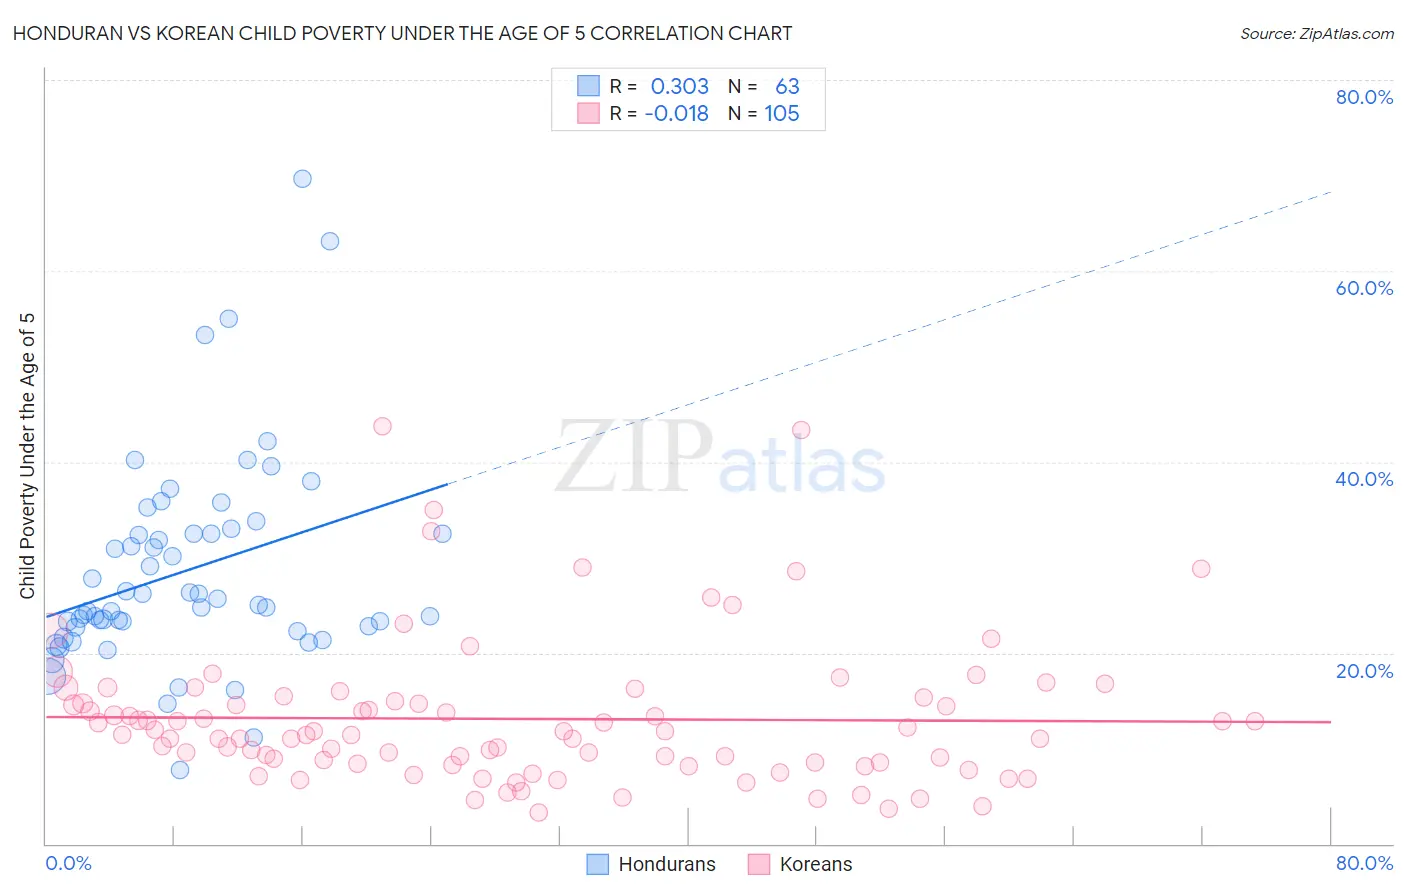
Honduran vs Korean Child Poverty Under the Age of 5 Correlation Chart
The statistical analysis conducted on geographies consisting of 349,714,748 people shows a mild positive correlation between the proportion of Hondurans and poverty level among children under the age of 5 in the United States with a correlation coefficient (R) of 0.303 and weighted average of 23.0%. Similarly, the statistical analysis conducted on geographies consisting of 483,948,585 people shows no correlation between the proportion of Koreans and poverty level among children under the age of 5 in the United States with a correlation coefficient (R) of -0.018 and weighted average of 14.4%, a difference of 59.4%.
Child Poverty Under the Age of 5 Correlation Summary
| Measurement | Honduran | Korean |
| Minimum | 7.7% | 3.3% |
| Maximum | 69.6% | 43.8% |
| Range | 61.9% | 40.5% |
| Mean | 28.6% | 13.1% |
| Median | 25.0% | 11.4% |
| Interquartile 25% (IQ1) | 22.7% | 8.5% |
| Interquartile 75% (IQ3) | 32.5% | 15.2% |
| Interquartile Range (IQR) | 9.8% | 6.7% |
| Standard Deviation (Sample) | 11.0% | 7.5% |
| Standard Deviation (Population) | 10.9% | 7.5% |
Similar Demographics by Child Poverty Under the Age of 5
Demographics Similar to Hondurans by Child Poverty Under the Age of 5
In terms of child poverty under the age of 5, the demographic groups most similar to Hondurans are Bahamian (23.0%, a difference of 0.050%), U.S. Virgin Islander (23.0%, a difference of 0.14%), Seminole (22.8%, a difference of 0.60%), African (22.8%, a difference of 0.64%), and Arapaho (23.1%, a difference of 0.70%).
| Demographics | Rating | Rank | Child Poverty Under the Age of 5 |
| Immigrants | Mexico | 0.0 /100 | #305 | Tragic 22.2% |
| Indonesians | 0.0 /100 | #306 | Tragic 22.3% |
| Immigrants | Bahamas | 0.0 /100 | #307 | Tragic 22.7% |
| Immigrants | Dominica | 0.0 /100 | #308 | Tragic 22.7% |
| Houma | 0.0 /100 | #309 | Tragic 22.7% |
| Africans | 0.0 /100 | #310 | Tragic 22.8% |
| Seminole | 0.0 /100 | #311 | Tragic 22.8% |
| Hondurans | 0.0 /100 | #312 | Tragic 23.0% |
| Bahamians | 0.0 /100 | #313 | Tragic 23.0% |
| U.S. Virgin Islanders | 0.0 /100 | #314 | Tragic 23.0% |
| Arapaho | 0.0 /100 | #315 | Tragic 23.1% |
| Yakama | 0.0 /100 | #316 | Tragic 23.1% |
| Menominee | 0.0 /100 | #317 | Tragic 23.3% |
| Dutch West Indians | 0.0 /100 | #318 | Tragic 23.3% |
| Chippewa | 0.0 /100 | #319 | Tragic 23.4% |
Demographics Similar to Koreans by Child Poverty Under the Age of 5
In terms of child poverty under the age of 5, the demographic groups most similar to Koreans are Cambodian (14.4%, a difference of 0.030%), Immigrants from Asia (14.4%, a difference of 0.080%), Immigrants from Sri Lanka (14.4%, a difference of 0.28%), Immigrants from Indonesia (14.3%, a difference of 0.47%), and Taiwanese (14.5%, a difference of 0.58%).
| Demographics | Rating | Rank | Child Poverty Under the Age of 5 |
| Asians | 99.9 /100 | #24 | Exceptional 14.0% |
| Cypriots | 99.9 /100 | #25 | Exceptional 14.0% |
| Immigrants | Lithuania | 99.9 /100 | #26 | Exceptional 14.1% |
| Tongans | 99.9 /100 | #27 | Exceptional 14.2% |
| Immigrants | Indonesia | 99.8 /100 | #28 | Exceptional 14.3% |
| Immigrants | Asia | 99.8 /100 | #29 | Exceptional 14.4% |
| Cambodians | 99.8 /100 | #30 | Exceptional 14.4% |
| Koreans | 99.8 /100 | #31 | Exceptional 14.4% |
| Immigrants | Sri Lanka | 99.8 /100 | #32 | Exceptional 14.4% |
| Taiwanese | 99.8 /100 | #33 | Exceptional 14.5% |
| Immigrants | Moldova | 99.8 /100 | #34 | Exceptional 14.5% |
| Latvians | 99.8 /100 | #35 | Exceptional 14.5% |
| Maltese | 99.8 /100 | #36 | Exceptional 14.5% |
| Turks | 99.7 /100 | #37 | Exceptional 14.6% |
| Eastern Europeans | 99.7 /100 | #38 | Exceptional 14.6% |