Chinese vs Korean Child Poverty Under the Age of 5
COMPARE
Chinese
Korean
Child Poverty Under the Age of 5
Child Poverty Under the Age of 5 Comparison
Chinese
Koreans
13.1%
CHILD POVERTY UNDER THE AGE OF 5
100.0/ 100
METRIC RATING
7th/ 347
METRIC RANK
14.4%
CHILD POVERTY UNDER THE AGE OF 5
99.8/ 100
METRIC RATING
31st/ 347
METRIC RANK
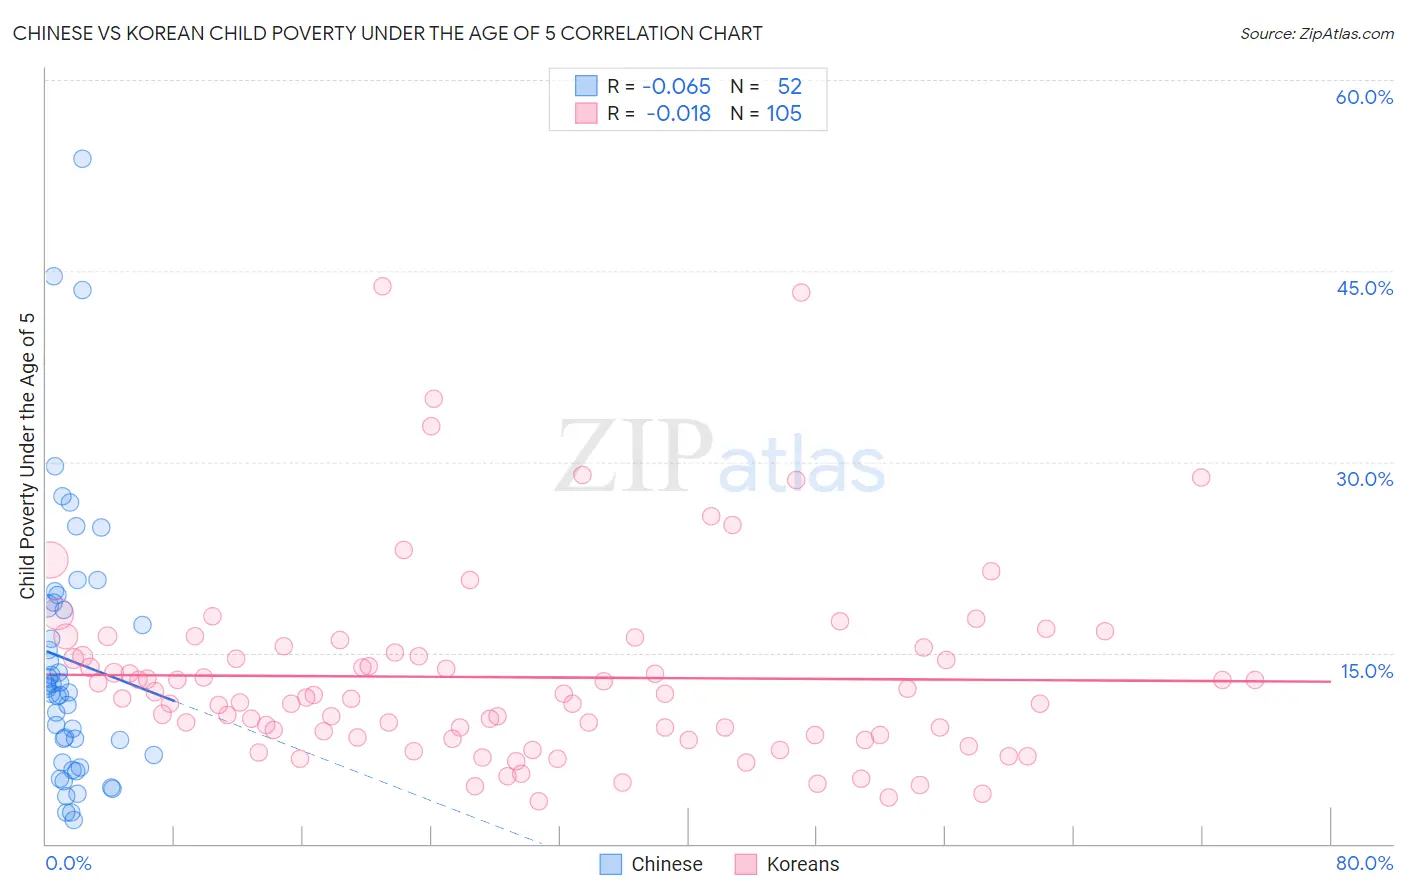
Chinese vs Korean Child Poverty Under the Age of 5 Correlation Chart
The statistical analysis conducted on geographies consisting of 64,186,861 people shows a slight negative correlation between the proportion of Chinese and poverty level among children under the age of 5 in the United States with a correlation coefficient (R) of -0.065 and weighted average of 13.1%. Similarly, the statistical analysis conducted on geographies consisting of 483,948,585 people shows no correlation between the proportion of Koreans and poverty level among children under the age of 5 in the United States with a correlation coefficient (R) of -0.018 and weighted average of 14.4%, a difference of 10.3%.
Child Poverty Under the Age of 5 Correlation Summary
| Measurement | Chinese | Korean |
| Minimum | 1.9% | 3.3% |
| Maximum | 53.8% | 43.8% |
| Range | 52.0% | 40.5% |
| Mean | 14.4% | 13.1% |
| Median | 12.1% | 11.4% |
| Interquartile 25% (IQ1) | 6.7% | 8.5% |
| Interquartile 75% (IQ3) | 18.8% | 15.2% |
| Interquartile Range (IQR) | 12.1% | 6.7% |
| Standard Deviation (Sample) | 10.8% | 7.5% |
| Standard Deviation (Population) | 10.7% | 7.5% |
Similar Demographics by Child Poverty Under the Age of 5
Demographics Similar to Chinese by Child Poverty Under the Age of 5
In terms of child poverty under the age of 5, the demographic groups most similar to Chinese are Iranian (13.1%, a difference of 0.020%), Immigrants from Iran (13.1%, a difference of 0.17%), Immigrants from Singapore (12.9%, a difference of 0.98%), Burmese (13.2%, a difference of 1.3%), and Immigrants from Korea (13.2%, a difference of 1.4%).
| Demographics | Rating | Rank | Child Poverty Under the Age of 5 |
| Immigrants | India | 100.0 /100 | #1 | Exceptional 11.5% |
| Immigrants | Taiwan | 100.0 /100 | #2 | Exceptional 11.6% |
| Filipinos | 100.0 /100 | #3 | Exceptional 11.6% |
| Thais | 100.0 /100 | #4 | Exceptional 12.3% |
| Immigrants | Hong Kong | 100.0 /100 | #5 | Exceptional 12.4% |
| Immigrants | Singapore | 100.0 /100 | #6 | Exceptional 12.9% |
| Chinese | 100.0 /100 | #7 | Exceptional 13.1% |
| Iranians | 100.0 /100 | #8 | Exceptional 13.1% |
| Immigrants | Iran | 100.0 /100 | #9 | Exceptional 13.1% |
| Burmese | 100.0 /100 | #10 | Exceptional 13.2% |
| Immigrants | Korea | 100.0 /100 | #11 | Exceptional 13.2% |
| Immigrants | South Central Asia | 100.0 /100 | #12 | Exceptional 13.3% |
| Bhutanese | 100.0 /100 | #13 | Exceptional 13.4% |
| Okinawans | 100.0 /100 | #14 | Exceptional 13.4% |
| Indians (Asian) | 100.0 /100 | #15 | Exceptional 13.4% |
Demographics Similar to Koreans by Child Poverty Under the Age of 5
In terms of child poverty under the age of 5, the demographic groups most similar to Koreans are Cambodian (14.4%, a difference of 0.030%), Immigrants from Asia (14.4%, a difference of 0.080%), Immigrants from Sri Lanka (14.4%, a difference of 0.28%), Immigrants from Indonesia (14.3%, a difference of 0.47%), and Taiwanese (14.5%, a difference of 0.58%).
| Demographics | Rating | Rank | Child Poverty Under the Age of 5 |
| Asians | 99.9 /100 | #24 | Exceptional 14.0% |
| Cypriots | 99.9 /100 | #25 | Exceptional 14.0% |
| Immigrants | Lithuania | 99.9 /100 | #26 | Exceptional 14.1% |
| Tongans | 99.9 /100 | #27 | Exceptional 14.2% |
| Immigrants | Indonesia | 99.8 /100 | #28 | Exceptional 14.3% |
| Immigrants | Asia | 99.8 /100 | #29 | Exceptional 14.4% |
| Cambodians | 99.8 /100 | #30 | Exceptional 14.4% |
| Koreans | 99.8 /100 | #31 | Exceptional 14.4% |
| Immigrants | Sri Lanka | 99.8 /100 | #32 | Exceptional 14.4% |
| Taiwanese | 99.8 /100 | #33 | Exceptional 14.5% |
| Immigrants | Moldova | 99.8 /100 | #34 | Exceptional 14.5% |
| Latvians | 99.8 /100 | #35 | Exceptional 14.5% |
| Maltese | 99.8 /100 | #36 | Exceptional 14.5% |
| Turks | 99.7 /100 | #37 | Exceptional 14.6% |
| Eastern Europeans | 99.7 /100 | #38 | Exceptional 14.6% |