Syrian vs Arab Per Capita Income
COMPARE
Syrian
Arab
Per Capita Income
Per Capita Income Comparison
Syrians
Arabs
$46,837
PER CAPITA INCOME
97.2/ 100
METRIC RATING
103rd/ 347
METRIC RANK
$45,662
PER CAPITA INCOME
90.4/ 100
METRIC RATING
130th/ 347
METRIC RANK
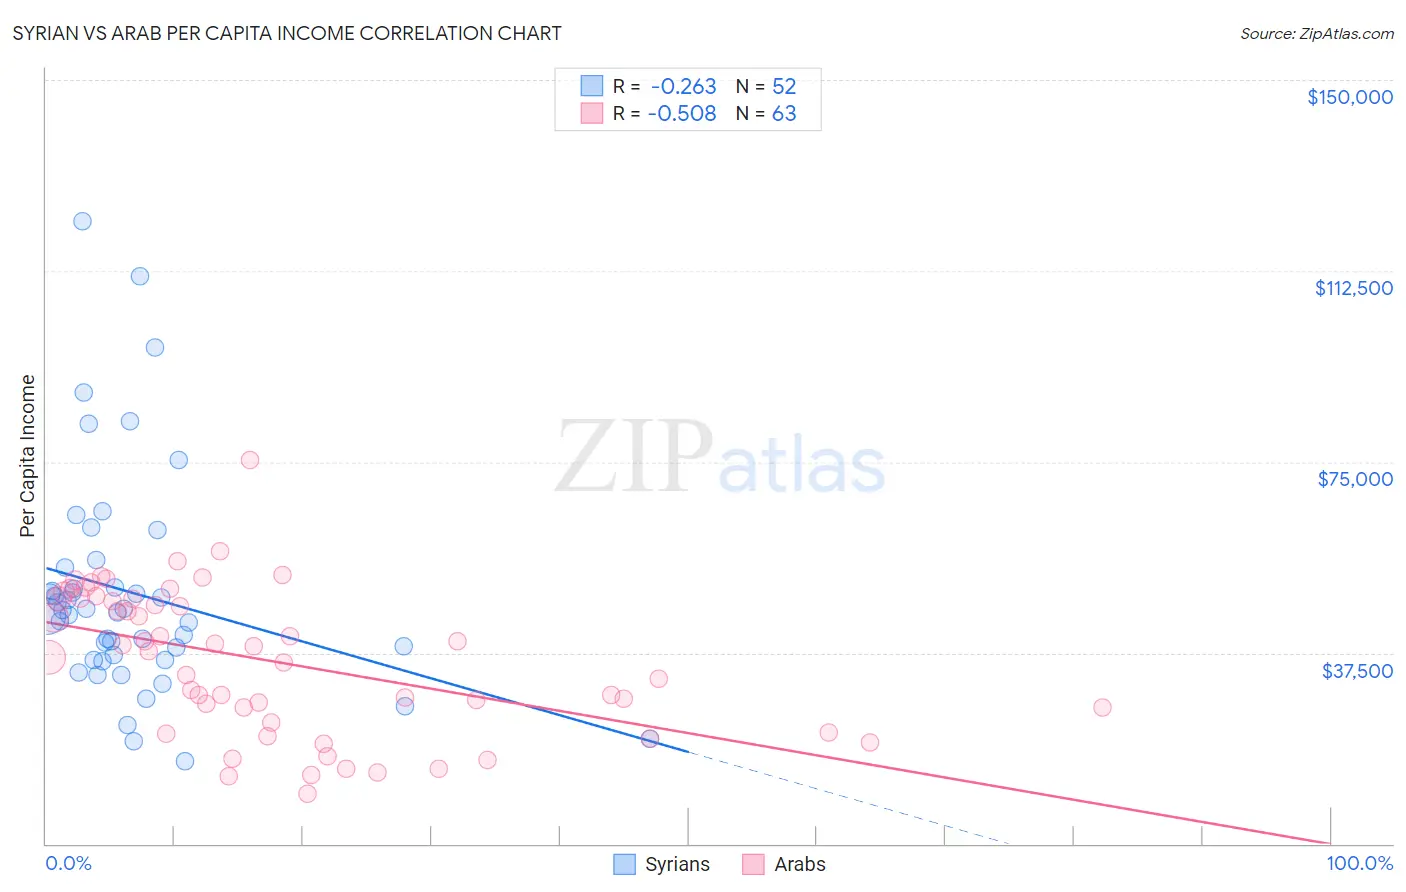
Syrian vs Arab Per Capita Income Correlation Chart
The statistical analysis conducted on geographies consisting of 266,332,251 people shows a weak negative correlation between the proportion of Syrians and per capita income in the United States with a correlation coefficient (R) of -0.263 and weighted average of $46,837. Similarly, the statistical analysis conducted on geographies consisting of 486,915,485 people shows a substantial negative correlation between the proportion of Arabs and per capita income in the United States with a correlation coefficient (R) of -0.508 and weighted average of $45,662, a difference of 2.6%.
Per Capita Income Correlation Summary
| Measurement | Syrian | Arab |
| Minimum | $16,296 | $9,805 |
| Maximum | $122,379 | $75,372 |
| Range | $106,083 | $65,567 |
| Mean | $49,326 | $35,873 |
| Median | $45,708 | $37,723 |
| Interquartile 25% (IQ1) | $36,580 | $23,895 |
| Interquartile 75% (IQ3) | $52,298 | $48,040 |
| Interquartile Range (IQR) | $15,717 | $24,145 |
| Standard Deviation (Sample) | $21,603 | $14,217 |
| Standard Deviation (Population) | $21,394 | $14,103 |
Similar Demographics by Per Capita Income
Demographics Similar to Syrians by Per Capita Income
In terms of per capita income, the demographic groups most similar to Syrians are Immigrants from Western Asia ($46,876, a difference of 0.080%), Immigrants from Uzbekistan ($46,929, a difference of 0.20%), Immigrants from Lebanon ($46,938, a difference of 0.22%), Brazilian ($46,700, a difference of 0.29%), and Laotian ($47,041, a difference of 0.43%).
| Demographics | Rating | Rank | Per Capita Income |
| Alsatians | 98.3 /100 | #96 | Exceptional $47,284 |
| Carpatho Rusyns | 98.2 /100 | #97 | Exceptional $47,248 |
| Immigrants | Pakistan | 97.9 /100 | #98 | Exceptional $47,084 |
| Laotians | 97.8 /100 | #99 | Exceptional $47,041 |
| Immigrants | Lebanon | 97.5 /100 | #100 | Exceptional $46,938 |
| Immigrants | Uzbekistan | 97.5 /100 | #101 | Exceptional $46,929 |
| Immigrants | Western Asia | 97.4 /100 | #102 | Exceptional $46,876 |
| Syrians | 97.2 /100 | #103 | Exceptional $46,837 |
| Brazilians | 96.8 /100 | #104 | Exceptional $46,700 |
| British | 96.3 /100 | #105 | Exceptional $46,571 |
| Ethiopians | 96.3 /100 | #106 | Exceptional $46,569 |
| Serbians | 96.2 /100 | #107 | Exceptional $46,551 |
| Immigrants | Kuwait | 96.2 /100 | #108 | Exceptional $46,543 |
| Immigrants | Northern Africa | 96.2 /100 | #109 | Exceptional $46,531 |
| Chileans | 95.9 /100 | #110 | Exceptional $46,459 |
Demographics Similar to Arabs by Per Capita Income
In terms of per capita income, the demographic groups most similar to Arabs are Luxembourger ($45,663, a difference of 0.0%), Immigrants from North Macedonia ($45,622, a difference of 0.090%), Jordanian ($45,605, a difference of 0.12%), Pakistani ($45,587, a difference of 0.16%), and Slovene ($45,581, a difference of 0.18%).
| Demographics | Rating | Rank | Per Capita Income |
| Lebanese | 92.0 /100 | #123 | Exceptional $45,840 |
| Europeans | 92.0 /100 | #124 | Exceptional $45,836 |
| Zimbabweans | 91.7 /100 | #125 | Exceptional $45,804 |
| Palestinians | 91.6 /100 | #126 | Exceptional $45,790 |
| Immigrants | Germany | 91.3 /100 | #127 | Exceptional $45,751 |
| Swedes | 91.3 /100 | #128 | Exceptional $45,750 |
| Luxembourgers | 90.4 /100 | #129 | Exceptional $45,663 |
| Arabs | 90.4 /100 | #130 | Exceptional $45,662 |
| Immigrants | North Macedonia | 90.0 /100 | #131 | Exceptional $45,622 |
| Jordanians | 89.9 /100 | #132 | Excellent $45,605 |
| Pakistanis | 89.7 /100 | #133 | Excellent $45,587 |
| Slovenes | 89.6 /100 | #134 | Excellent $45,581 |
| Hungarians | 87.9 /100 | #135 | Excellent $45,426 |
| Immigrants | Oceania | 85.2 /100 | #136 | Excellent $45,220 |
| Immigrants | Syria | 85.2 /100 | #137 | Excellent $45,218 |