Swiss vs Immigrants from Uruguay Female Poverty
COMPARE
Swiss
Immigrants from Uruguay
Female Poverty
Female Poverty Comparison
Swiss
Immigrants from Uruguay
12.2%
FEMALE POVERTY
97.7/ 100
METRIC RATING
69th/ 347
METRIC RANK
14.0%
FEMALE POVERTY
14.0/ 100
METRIC RATING
206th/ 347
METRIC RANK
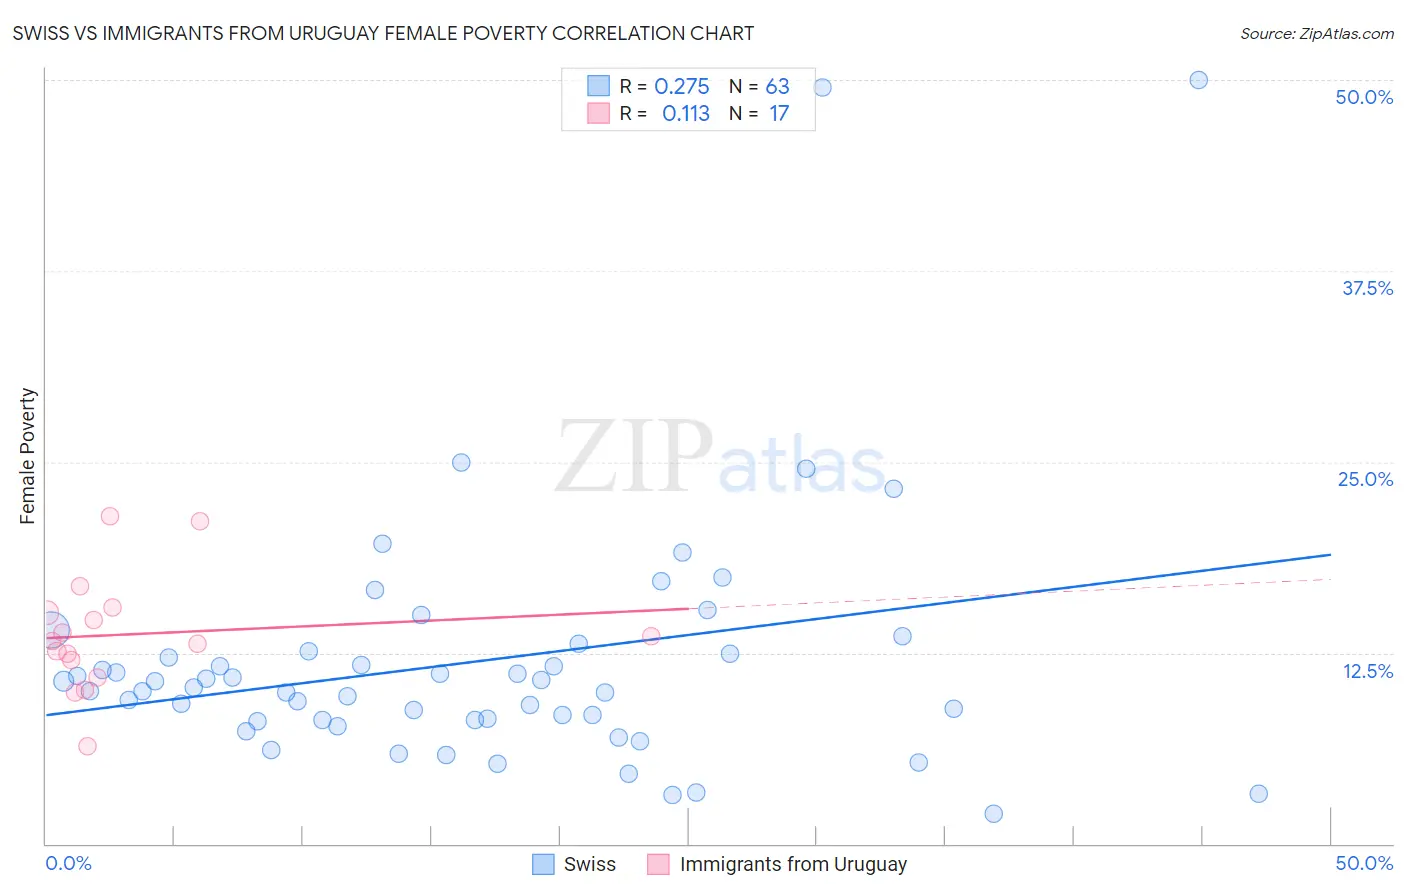
Swiss vs Immigrants from Uruguay Female Poverty Correlation Chart
The statistical analysis conducted on geographies consisting of 464,552,447 people shows a weak positive correlation between the proportion of Swiss and poverty level among females in the United States with a correlation coefficient (R) of 0.275 and weighted average of 12.2%. Similarly, the statistical analysis conducted on geographies consisting of 133,241,940 people shows a poor positive correlation between the proportion of Immigrants from Uruguay and poverty level among females in the United States with a correlation coefficient (R) of 0.113 and weighted average of 14.0%, a difference of 14.7%.
Female Poverty Correlation Summary
| Measurement | Swiss | Immigrants from Uruguay |
| Minimum | 1.9% | 6.4% |
| Maximum | 50.0% | 21.5% |
| Range | 48.1% | 15.1% |
| Mean | 11.9% | 13.7% |
| Median | 10.2% | 13.3% |
| Interquartile 25% (IQ1) | 8.1% | 11.4% |
| Interquartile 75% (IQ3) | 12.6% | 15.3% |
| Interquartile Range (IQR) | 4.5% | 3.9% |
| Standard Deviation (Sample) | 8.4% | 3.8% |
| Standard Deviation (Population) | 8.3% | 3.7% |
Similar Demographics by Female Poverty
Demographics Similar to Swiss by Female Poverty
In terms of female poverty, the demographic groups most similar to Swiss are Immigrants from Belgium (12.2%, a difference of 0.030%), Immigrants from Netherlands (12.2%, a difference of 0.10%), Immigrants from Eastern Asia (12.2%, a difference of 0.14%), Carpatho Rusyn (12.2%, a difference of 0.15%), and Cambodian (12.2%, a difference of 0.19%).
| Demographics | Rating | Rank | Female Poverty |
| Immigrants | Italy | 98.0 /100 | #62 | Exceptional 12.2% |
| Ukrainians | 98.0 /100 | #63 | Exceptional 12.2% |
| Germans | 98.0 /100 | #64 | Exceptional 12.2% |
| Indians (Asian) | 97.9 /100 | #65 | Exceptional 12.2% |
| Austrians | 97.9 /100 | #66 | Exceptional 12.2% |
| Immigrants | Eastern Asia | 97.8 /100 | #67 | Exceptional 12.2% |
| Immigrants | Netherlands | 97.8 /100 | #68 | Exceptional 12.2% |
| Swiss | 97.7 /100 | #69 | Exceptional 12.2% |
| Immigrants | Belgium | 97.7 /100 | #70 | Exceptional 12.2% |
| Carpatho Rusyns | 97.6 /100 | #71 | Exceptional 12.2% |
| Cambodians | 97.5 /100 | #72 | Exceptional 12.2% |
| Zimbabweans | 97.5 /100 | #73 | Exceptional 12.3% |
| Immigrants | Canada | 97.5 /100 | #74 | Exceptional 12.3% |
| Europeans | 97.4 /100 | #75 | Exceptional 12.3% |
| Immigrants | Eastern Europe | 97.2 /100 | #76 | Exceptional 12.3% |
Demographics Similar to Immigrants from Uruguay by Female Poverty
In terms of female poverty, the demographic groups most similar to Immigrants from Uruguay are Ugandan (14.0%, a difference of 0.27%), Spaniard (13.9%, a difference of 0.84%), Immigrants from Western Asia (13.9%, a difference of 1.1%), Immigrants from Eastern Africa (14.2%, a difference of 1.1%), and Hmong (13.9%, a difference of 1.2%).
| Demographics | Rating | Rank | Female Poverty |
| Immigrants | Lebanon | 25.6 /100 | #199 | Fair 13.8% |
| Spanish | 21.4 /100 | #200 | Fair 13.9% |
| Immigrants | Kenya | 21.1 /100 | #201 | Fair 13.9% |
| Hmong | 21.1 /100 | #202 | Fair 13.9% |
| Immigrants | Western Asia | 20.7 /100 | #203 | Fair 13.9% |
| Spaniards | 18.9 /100 | #204 | Poor 13.9% |
| Ugandans | 15.4 /100 | #205 | Poor 14.0% |
| Immigrants | Uruguay | 14.0 /100 | #206 | Poor 14.0% |
| Immigrants | Eastern Africa | 9.0 /100 | #207 | Tragic 14.2% |
| Immigrants | Azores | 7.9 /100 | #208 | Tragic 14.2% |
| Panamanians | 7.7 /100 | #209 | Tragic 14.2% |
| Malaysians | 7.4 /100 | #210 | Tragic 14.3% |
| Moroccans | 7.2 /100 | #211 | Tragic 14.3% |
| Bermudans | 5.5 /100 | #212 | Tragic 14.4% |
| Alaskan Athabascans | 5.3 /100 | #213 | Tragic 14.4% |