Swedish vs Yugoslavian Single Father Poverty
COMPARE
Swedish
Yugoslavian
Single Father Poverty
Single Father Poverty Comparison
Swedes
Yugoslavians
16.3%
SINGLE FATHER POVERTY
50.0/ 100
METRIC RATING
174th/ 347
METRIC RANK
16.3%
SINGLE FATHER POVERTY
53.9/ 100
METRIC RATING
167th/ 347
METRIC RANK
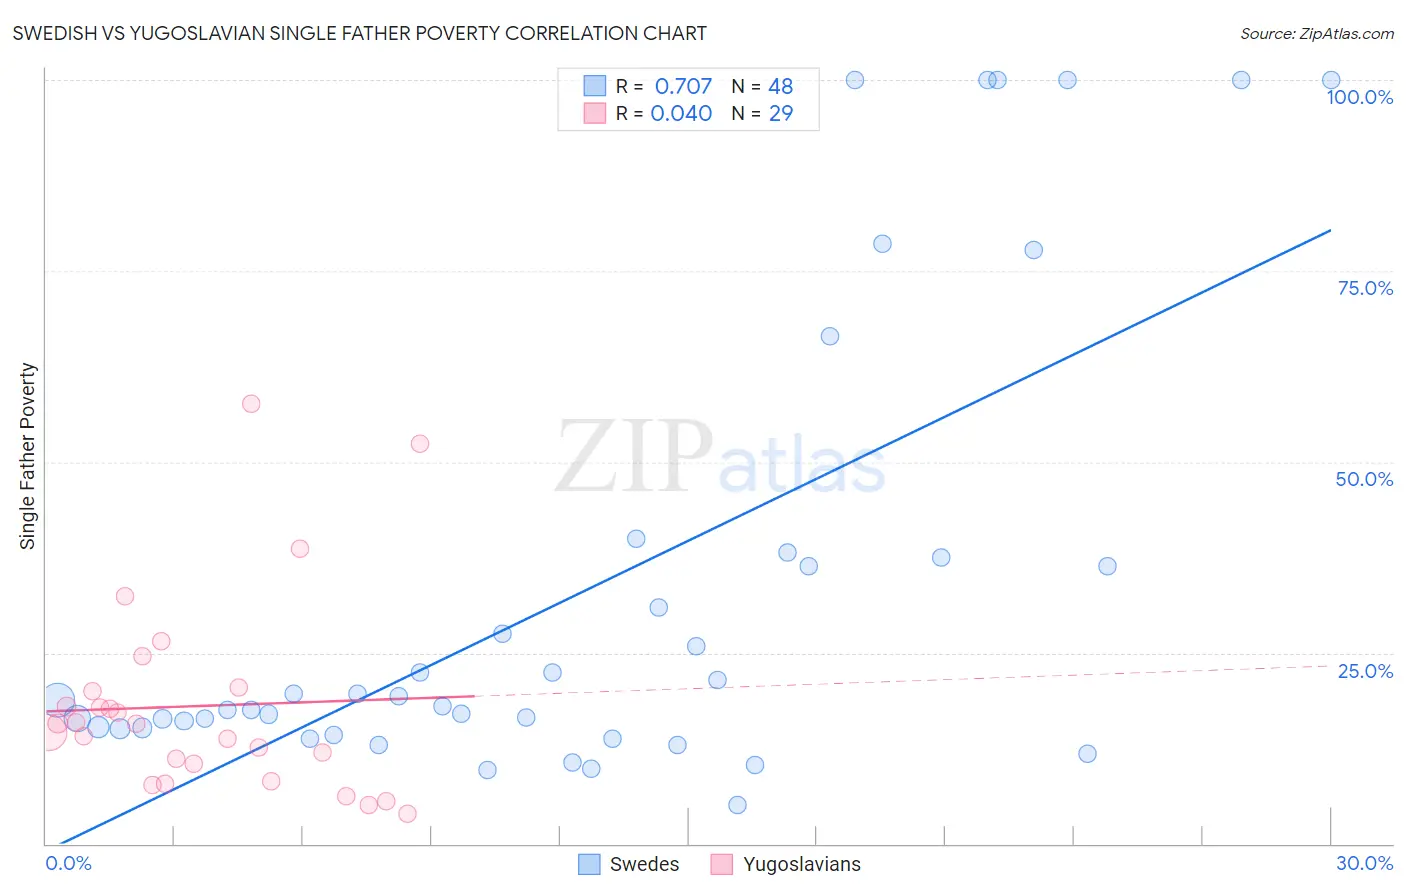
Swedish vs Yugoslavian Single Father Poverty Correlation Chart
The statistical analysis conducted on geographies consisting of 390,500,833 people shows a strong positive correlation between the proportion of Swedes and poverty level among single fathers in the United States with a correlation coefficient (R) of 0.707 and weighted average of 16.3%. Similarly, the statistical analysis conducted on geographies consisting of 233,019,111 people shows no correlation between the proportion of Yugoslavians and poverty level among single fathers in the United States with a correlation coefficient (R) of 0.040 and weighted average of 16.3%, a difference of 0.17%.
Single Father Poverty Correlation Summary
| Measurement | Swedish | Yugoslavian |
| Minimum | 5.1% | 4.0% |
| Maximum | 100.0% | 57.7% |
| Range | 94.9% | 53.7% |
| Mean | 32.9% | 18.0% |
| Median | 18.4% | 15.7% |
| Interquartile 25% (IQ1) | 15.1% | 9.3% |
| Interquartile 75% (IQ3) | 36.9% | 20.2% |
| Interquartile Range (IQR) | 21.9% | 10.9% |
| Standard Deviation (Sample) | 30.0% | 13.0% |
| Standard Deviation (Population) | 29.7% | 12.8% |
Demographics Similar to Swedes and Yugoslavians by Single Father Poverty
In terms of single father poverty, the demographic groups most similar to Swedes are Immigrants from Sierra Leone (16.3%, a difference of 0.0%), Immigrants from St. Vincent and the Grenadines (16.3%, a difference of 0.0%), Immigrants from Ecuador (16.3%, a difference of 0.020%), Immigrants from Morocco (16.3%, a difference of 0.030%), and Vietnamese (16.3%, a difference of 0.090%). Similarly, the demographic groups most similar to Yugoslavians are Costa Rican (16.3%, a difference of 0.010%), Immigrants from Europe (16.3%, a difference of 0.040%), Immigrants from Bangladesh (16.3%, a difference of 0.050%), Northern European (16.3%, a difference of 0.050%), and Guyanese (16.3%, a difference of 0.060%).
| Demographics | Rating | Rank | Single Father Poverty |
| Immigrants | Sudan | 59.8 /100 | #160 | Average 16.2% |
| Estonians | 56.7 /100 | #161 | Average 16.2% |
| Ugandans | 55.9 /100 | #162 | Average 16.3% |
| Immigrants | Costa Rica | 55.7 /100 | #163 | Average 16.3% |
| Guyanese | 55.2 /100 | #164 | Average 16.3% |
| Immigrants | Bangladesh | 55.1 /100 | #165 | Average 16.3% |
| Immigrants | Europe | 54.8 /100 | #166 | Average 16.3% |
| Yugoslavians | 53.9 /100 | #167 | Average 16.3% |
| Costa Ricans | 53.6 /100 | #168 | Average 16.3% |
| Northern Europeans | 52.8 /100 | #169 | Average 16.3% |
| Scandinavians | 52.3 /100 | #170 | Average 16.3% |
| Immigrants | Morocco | 50.7 /100 | #171 | Average 16.3% |
| Immigrants | Sierra Leone | 50.1 /100 | #172 | Average 16.3% |
| Immigrants | St. Vincent and the Grenadines | 50.0 /100 | #173 | Average 16.3% |
| Swedes | 50.0 /100 | #174 | Average 16.3% |
| Immigrants | Ecuador | 49.7 /100 | #175 | Average 16.3% |
| Vietnamese | 48.0 /100 | #176 | Average 16.3% |
| Immigrants | South Africa | 44.2 /100 | #177 | Average 16.3% |
| Immigrants | Cuba | 41.6 /100 | #178 | Average 16.4% |
| Serbians | 40.9 /100 | #179 | Average 16.4% |
| Immigrants | Latin America | 37.2 /100 | #180 | Fair 16.4% |