Swedish vs Cajun Female Poverty
COMPARE
Swedish
Cajun
Female Poverty
Female Poverty Comparison
Swedes
Cajuns
11.6%
FEMALE POVERTY
99.7/ 100
METRIC RATING
22nd/ 347
METRIC RANK
17.5%
FEMALE POVERTY
0.0/ 100
METRIC RATING
319th/ 347
METRIC RANK
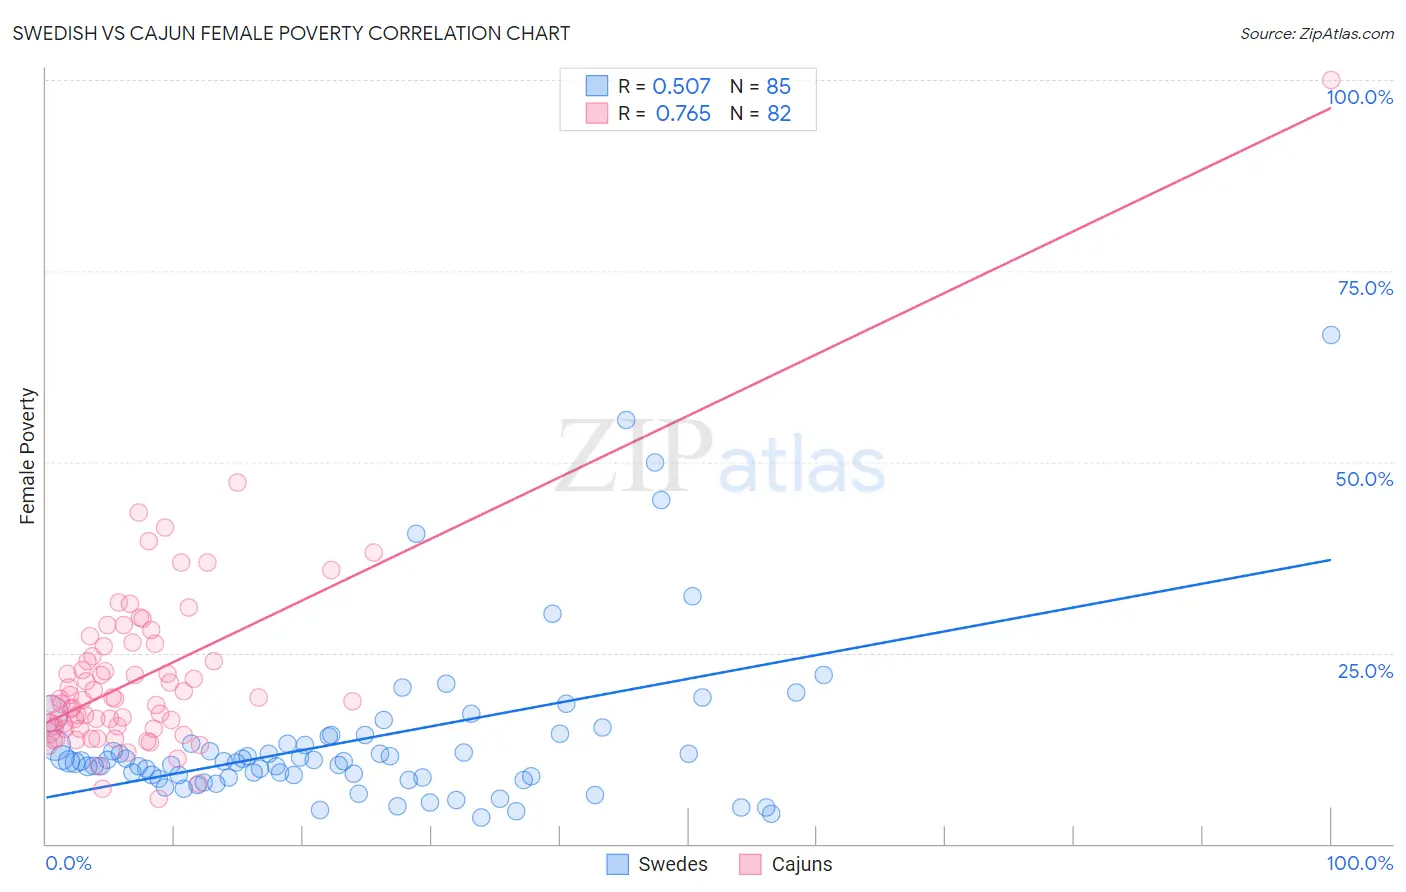
Swedish vs Cajun Female Poverty Correlation Chart
The statistical analysis conducted on geographies consisting of 538,313,222 people shows a substantial positive correlation between the proportion of Swedes and poverty level among females in the United States with a correlation coefficient (R) of 0.507 and weighted average of 11.6%. Similarly, the statistical analysis conducted on geographies consisting of 149,687,613 people shows a strong positive correlation between the proportion of Cajuns and poverty level among females in the United States with a correlation coefficient (R) of 0.765 and weighted average of 17.5%, a difference of 50.6%.
Female Poverty Correlation Summary
| Measurement | Swedish | Cajun |
| Minimum | 3.4% | 5.9% |
| Maximum | 66.7% | 100.0% |
| Range | 63.3% | 94.1% |
| Mean | 13.6% | 21.9% |
| Median | 10.8% | 18.9% |
| Interquartile 25% (IQ1) | 8.7% | 15.1% |
| Interquartile 75% (IQ3) | 13.6% | 25.9% |
| Interquartile Range (IQR) | 5.0% | 10.8% |
| Standard Deviation (Sample) | 11.0% | 12.1% |
| Standard Deviation (Population) | 10.9% | 12.1% |
Similar Demographics by Female Poverty
Demographics Similar to Swedes by Female Poverty
In terms of female poverty, the demographic groups most similar to Swedes are Italian (11.6%, a difference of 0.030%), Burmese (11.6%, a difference of 0.14%), Luxembourger (11.6%, a difference of 0.16%), Immigrants from Northern Europe (11.6%, a difference of 0.42%), and Croatian (11.6%, a difference of 0.43%).
| Demographics | Rating | Rank | Female Poverty |
| Latvians | 99.8 /100 | #15 | Exceptional 11.4% |
| Immigrants | Bolivia | 99.8 /100 | #16 | Exceptional 11.5% |
| Bolivians | 99.8 /100 | #17 | Exceptional 11.5% |
| Immigrants | Scotland | 99.8 /100 | #18 | Exceptional 11.5% |
| Norwegians | 99.8 /100 | #19 | Exceptional 11.5% |
| Eastern Europeans | 99.7 /100 | #20 | Exceptional 11.5% |
| Italians | 99.7 /100 | #21 | Exceptional 11.6% |
| Swedes | 99.7 /100 | #22 | Exceptional 11.6% |
| Burmese | 99.7 /100 | #23 | Exceptional 11.6% |
| Luxembourgers | 99.7 /100 | #24 | Exceptional 11.6% |
| Immigrants | Northern Europe | 99.6 /100 | #25 | Exceptional 11.6% |
| Croatians | 99.6 /100 | #26 | Exceptional 11.6% |
| Iranians | 99.6 /100 | #27 | Exceptional 11.7% |
| Immigrants | Korea | 99.6 /100 | #28 | Exceptional 11.7% |
| Immigrants | North Macedonia | 99.6 /100 | #29 | Exceptional 11.7% |
Demographics Similar to Cajuns by Female Poverty
In terms of female poverty, the demographic groups most similar to Cajuns are Ute (17.5%, a difference of 0.010%), Immigrants from Dominica (17.5%, a difference of 0.080%), Arapaho (17.5%, a difference of 0.15%), Immigrants from Congo (17.4%, a difference of 0.34%), and Honduran (17.4%, a difference of 0.53%).
| Demographics | Rating | Rank | Female Poverty |
| Immigrants | Somalia | 0.0 /100 | #312 | Tragic 17.0% |
| British West Indians | 0.0 /100 | #313 | Tragic 17.0% |
| Dutch West Indians | 0.0 /100 | #314 | Tragic 17.1% |
| U.S. Virgin Islanders | 0.0 /100 | #315 | Tragic 17.3% |
| Hondurans | 0.0 /100 | #316 | Tragic 17.4% |
| Immigrants | Congo | 0.0 /100 | #317 | Tragic 17.4% |
| Ute | 0.0 /100 | #318 | Tragic 17.5% |
| Cajuns | 0.0 /100 | #319 | Tragic 17.5% |
| Immigrants | Dominica | 0.0 /100 | #320 | Tragic 17.5% |
| Arapaho | 0.0 /100 | #321 | Tragic 17.5% |
| Menominee | 0.0 /100 | #322 | Tragic 17.6% |
| Paiute | 0.0 /100 | #323 | Tragic 17.7% |
| Immigrants | Honduras | 0.0 /100 | #324 | Tragic 17.7% |
| Colville | 0.0 /100 | #325 | Tragic 17.8% |
| Central American Indians | 0.0 /100 | #326 | Tragic 18.0% |