Swedish vs Immigrants from Iraq Female Poverty
COMPARE
Swedish
Immigrants from Iraq
Female Poverty
Female Poverty Comparison
Swedes
Immigrants from Iraq
11.6%
FEMALE POVERTY
99.7/ 100
METRIC RATING
22nd/ 347
METRIC RANK
13.4%
FEMALE POVERTY
50.0/ 100
METRIC RATING
174th/ 347
METRIC RANK
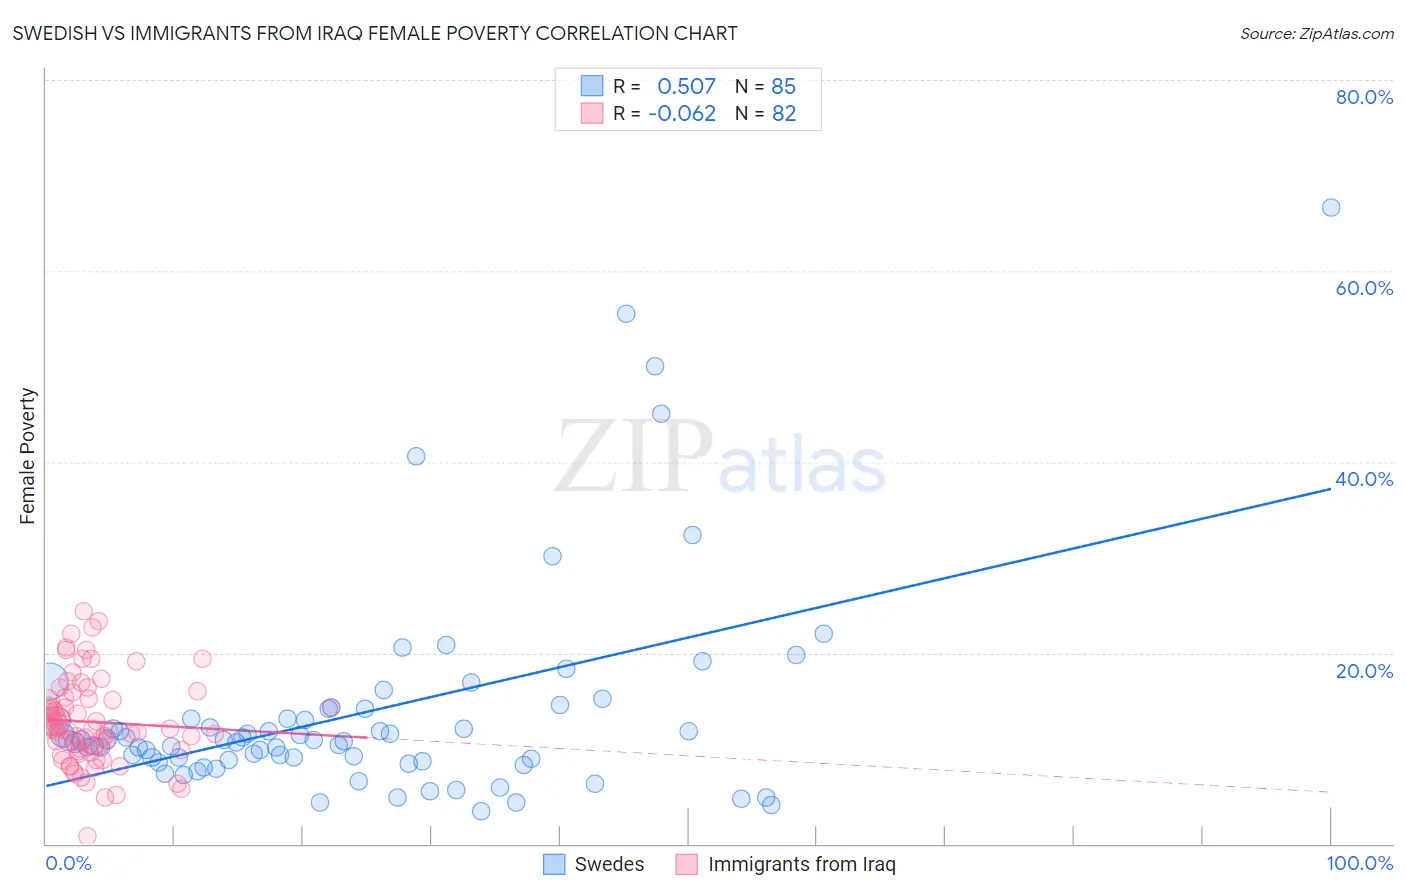
Swedish vs Immigrants from Iraq Female Poverty Correlation Chart
The statistical analysis conducted on geographies consisting of 538,313,222 people shows a substantial positive correlation between the proportion of Swedes and poverty level among females in the United States with a correlation coefficient (R) of 0.507 and weighted average of 11.6%. Similarly, the statistical analysis conducted on geographies consisting of 194,711,025 people shows a slight negative correlation between the proportion of Immigrants from Iraq and poverty level among females in the United States with a correlation coefficient (R) of -0.062 and weighted average of 13.4%, a difference of 16.0%.
Female Poverty Correlation Summary
| Measurement | Swedish | Immigrants from Iraq |
| Minimum | 3.4% | 0.80% |
| Maximum | 66.7% | 24.3% |
| Range | 63.3% | 23.5% |
| Mean | 13.6% | 12.7% |
| Median | 10.8% | 12.1% |
| Interquartile 25% (IQ1) | 8.7% | 9.8% |
| Interquartile 75% (IQ3) | 13.6% | 15.1% |
| Interquartile Range (IQR) | 5.0% | 5.3% |
| Standard Deviation (Sample) | 11.0% | 4.5% |
| Standard Deviation (Population) | 10.9% | 4.5% |
Similar Demographics by Female Poverty
Demographics Similar to Swedes by Female Poverty
In terms of female poverty, the demographic groups most similar to Swedes are Italian (11.6%, a difference of 0.030%), Burmese (11.6%, a difference of 0.14%), Luxembourger (11.6%, a difference of 0.16%), Immigrants from Northern Europe (11.6%, a difference of 0.42%), and Croatian (11.6%, a difference of 0.43%).
| Demographics | Rating | Rank | Female Poverty |
| Latvians | 99.8 /100 | #15 | Exceptional 11.4% |
| Immigrants | Bolivia | 99.8 /100 | #16 | Exceptional 11.5% |
| Bolivians | 99.8 /100 | #17 | Exceptional 11.5% |
| Immigrants | Scotland | 99.8 /100 | #18 | Exceptional 11.5% |
| Norwegians | 99.8 /100 | #19 | Exceptional 11.5% |
| Eastern Europeans | 99.7 /100 | #20 | Exceptional 11.5% |
| Italians | 99.7 /100 | #21 | Exceptional 11.6% |
| Swedes | 99.7 /100 | #22 | Exceptional 11.6% |
| Burmese | 99.7 /100 | #23 | Exceptional 11.6% |
| Luxembourgers | 99.7 /100 | #24 | Exceptional 11.6% |
| Immigrants | Northern Europe | 99.6 /100 | #25 | Exceptional 11.6% |
| Croatians | 99.6 /100 | #26 | Exceptional 11.6% |
| Iranians | 99.6 /100 | #27 | Exceptional 11.7% |
| Immigrants | Korea | 99.6 /100 | #28 | Exceptional 11.7% |
| Immigrants | North Macedonia | 99.6 /100 | #29 | Exceptional 11.7% |
Demographics Similar to Immigrants from Iraq by Female Poverty
In terms of female poverty, the demographic groups most similar to Immigrants from Iraq are Celtic (13.4%, a difference of 0.010%), Immigrants from Spain (13.4%, a difference of 0.010%), Immigrants from Morocco (13.4%, a difference of 0.060%), Immigrants from Afghanistan (13.4%, a difference of 0.070%), and Israeli (13.5%, a difference of 0.090%).
| Demographics | Rating | Rank | Female Poverty |
| Immigrants | Chile | 57.4 /100 | #167 | Average 13.3% |
| Aleuts | 56.7 /100 | #168 | Average 13.4% |
| Lebanese | 55.9 /100 | #169 | Average 13.4% |
| Colombians | 55.7 /100 | #170 | Average 13.4% |
| Whites/Caucasians | 54.6 /100 | #171 | Average 13.4% |
| Mongolians | 53.6 /100 | #172 | Average 13.4% |
| Immigrants | Afghanistan | 50.8 /100 | #173 | Average 13.4% |
| Immigrants | Iraq | 50.0 /100 | #174 | Average 13.4% |
| Celtics | 49.9 /100 | #175 | Average 13.4% |
| Immigrants | Spain | 49.9 /100 | #176 | Average 13.4% |
| Immigrants | Morocco | 49.4 /100 | #177 | Average 13.4% |
| Israelis | 49.1 /100 | #178 | Average 13.5% |
| Immigrants | Syria | 48.8 /100 | #179 | Average 13.5% |
| South Americans | 44.8 /100 | #180 | Average 13.5% |
| Venezuelans | 44.5 /100 | #181 | Average 13.5% |