Sudanese vs Mexican American Indian Female Poverty
COMPARE
Sudanese
Mexican American Indian
Female Poverty
Female Poverty Comparison
Sudanese
Mexican American Indians
15.2%
FEMALE POVERTY
0.5/ 100
METRIC RATING
240th/ 347
METRIC RANK
15.6%
FEMALE POVERTY
0.1/ 100
METRIC RATING
262nd/ 347
METRIC RANK
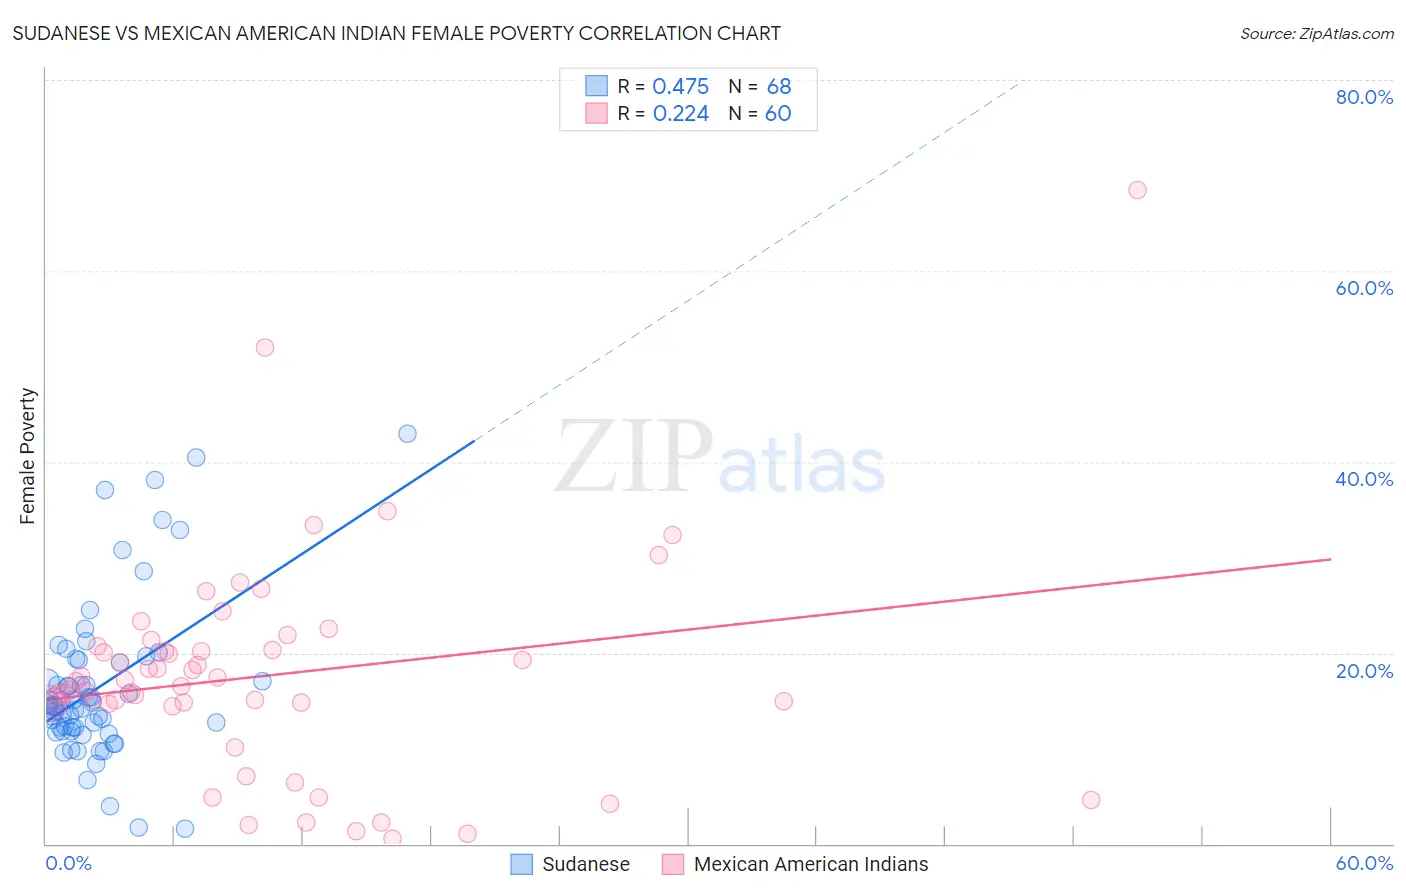
Sudanese vs Mexican American Indian Female Poverty Correlation Chart
The statistical analysis conducted on geographies consisting of 110,113,357 people shows a moderate positive correlation between the proportion of Sudanese and poverty level among females in the United States with a correlation coefficient (R) of 0.475 and weighted average of 15.2%. Similarly, the statistical analysis conducted on geographies consisting of 317,470,286 people shows a weak positive correlation between the proportion of Mexican American Indians and poverty level among females in the United States with a correlation coefficient (R) of 0.224 and weighted average of 15.6%, a difference of 2.8%.
Female Poverty Correlation Summary
| Measurement | Sudanese | Mexican American Indian |
| Minimum | 1.6% | 0.49% |
| Maximum | 43.0% | 68.4% |
| Range | 41.4% | 67.9% |
| Mean | 16.5% | 17.6% |
| Median | 14.4% | 16.8% |
| Interquartile 25% (IQ1) | 12.0% | 14.7% |
| Interquartile 75% (IQ3) | 19.1% | 20.5% |
| Interquartile Range (IQR) | 7.1% | 5.8% |
| Standard Deviation (Sample) | 8.3% | 11.5% |
| Standard Deviation (Population) | 8.3% | 11.4% |
Similar Demographics by Female Poverty
Demographics Similar to Sudanese by Female Poverty
In terms of female poverty, the demographic groups most similar to Sudanese are Immigrants from Middle Africa (15.2%, a difference of 0.050%), Immigrants from Sudan (15.2%, a difference of 0.25%), Nepalese (15.2%, a difference of 0.37%), Immigrants from Armenia (15.1%, a difference of 0.57%), and Nicaraguan (15.3%, a difference of 0.61%).
| Demographics | Rating | Rank | Female Poverty |
| Immigrants | Saudi Arabia | 1.4 /100 | #233 | Tragic 14.8% |
| Fijians | 1.1 /100 | #234 | Tragic 14.9% |
| Immigrants | Laos | 0.9 /100 | #235 | Tragic 15.0% |
| Cree | 0.7 /100 | #236 | Tragic 15.1% |
| French American Indians | 0.6 /100 | #237 | Tragic 15.1% |
| Immigrants | Armenia | 0.6 /100 | #238 | Tragic 15.1% |
| Immigrants | Middle Africa | 0.5 /100 | #239 | Tragic 15.2% |
| Sudanese | 0.5 /100 | #240 | Tragic 15.2% |
| Immigrants | Sudan | 0.4 /100 | #241 | Tragic 15.2% |
| Nepalese | 0.4 /100 | #242 | Tragic 15.2% |
| Nicaraguans | 0.3 /100 | #243 | Tragic 15.3% |
| Ecuadorians | 0.3 /100 | #244 | Tragic 15.3% |
| Spanish American Indians | 0.3 /100 | #245 | Tragic 15.3% |
| Cubans | 0.3 /100 | #246 | Tragic 15.3% |
| Potawatomi | 0.3 /100 | #247 | Tragic 15.3% |
Demographics Similar to Mexican American Indians by Female Poverty
In terms of female poverty, the demographic groups most similar to Mexican American Indians are Guyanese (15.6%, a difference of 0.0%), Cherokee (15.6%, a difference of 0.010%), Immigrants from Guyana (15.6%, a difference of 0.10%), Immigrants from Ecuador (15.6%, a difference of 0.14%), and Cape Verdean (15.6%, a difference of 0.18%).
| Demographics | Rating | Rank | Female Poverty |
| Ottawa | 0.2 /100 | #255 | Tragic 15.5% |
| Jamaicans | 0.2 /100 | #256 | Tragic 15.5% |
| Immigrants | Jamaica | 0.1 /100 | #257 | Tragic 15.6% |
| Shoshone | 0.1 /100 | #258 | Tragic 15.6% |
| Cape Verdeans | 0.1 /100 | #259 | Tragic 15.6% |
| Immigrants | Guyana | 0.1 /100 | #260 | Tragic 15.6% |
| Guyanese | 0.1 /100 | #261 | Tragic 15.6% |
| Mexican American Indians | 0.1 /100 | #262 | Tragic 15.6% |
| Cherokee | 0.1 /100 | #263 | Tragic 15.6% |
| Immigrants | Ecuador | 0.1 /100 | #264 | Tragic 15.6% |
| Immigrants | Liberia | 0.1 /100 | #265 | Tragic 15.7% |
| Immigrants | El Salvador | 0.1 /100 | #266 | Tragic 15.7% |
| Sub-Saharan Africans | 0.1 /100 | #267 | Tragic 15.8% |
| Immigrants | Nicaragua | 0.1 /100 | #268 | Tragic 15.8% |
| Iroquois | 0.1 /100 | #269 | Tragic 15.8% |