Sudanese vs Mexican American Indian Currently Married
COMPARE
Sudanese
Mexican American Indian
Currently Married
Currently Married Comparison
Sudanese
Mexican American Indians
43.7%
CURRENTLY MARRIED
0.1/ 100
METRIC RATING
264th/ 347
METRIC RANK
44.5%
CURRENTLY MARRIED
0.7/ 100
METRIC RATING
240th/ 347
METRIC RANK
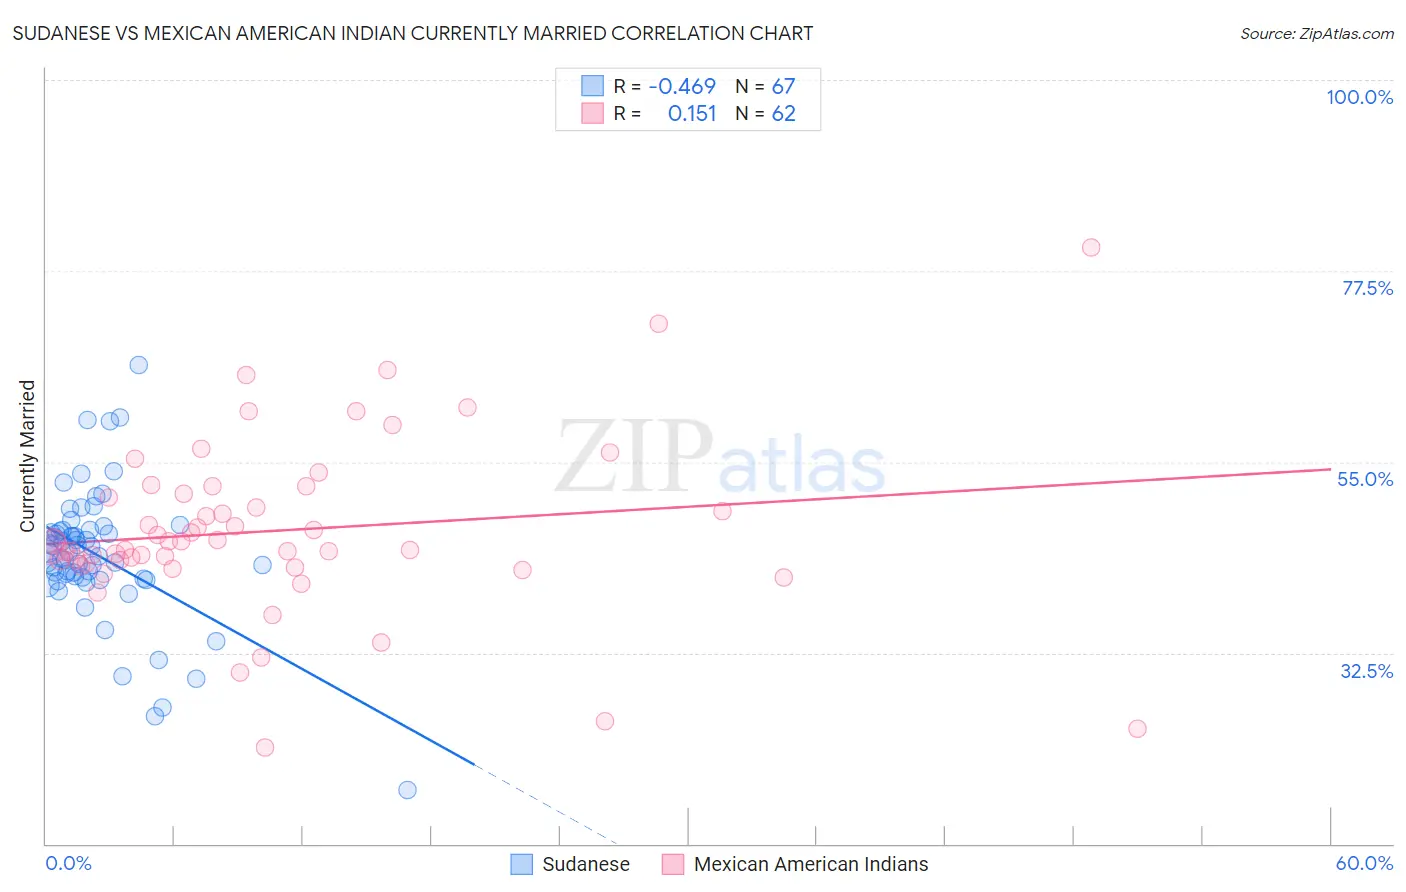
Sudanese vs Mexican American Indian Currently Married Correlation Chart
The statistical analysis conducted on geographies consisting of 110,133,540 people shows a moderate negative correlation between the proportion of Sudanese and percentage of population currently married in the United States with a correlation coefficient (R) of -0.469 and weighted average of 43.7%. Similarly, the statistical analysis conducted on geographies consisting of 317,602,518 people shows a poor positive correlation between the proportion of Mexican American Indians and percentage of population currently married in the United States with a correlation coefficient (R) of 0.151 and weighted average of 44.5%, a difference of 2.0%.
Currently Married Correlation Summary
| Measurement | Sudanese | Mexican American Indian |
| Minimum | 16.3% | 21.3% |
| Maximum | 66.4% | 80.2% |
| Range | 50.1% | 58.9% |
| Mean | 43.9% | 46.9% |
| Median | 44.3% | 45.3% |
| Interquartile 25% (IQ1) | 41.3% | 43.0% |
| Interquartile 75% (IQ3) | 46.9% | 51.2% |
| Interquartile Range (IQR) | 5.6% | 8.1% |
| Standard Deviation (Sample) | 8.0% | 10.3% |
| Standard Deviation (Population) | 7.9% | 10.2% |
Similar Demographics by Currently Married
Demographics Similar to Sudanese by Currently Married
In terms of currently married, the demographic groups most similar to Sudanese are Immigrants from Cuba (43.7%, a difference of 0.010%), Bangladeshi (43.7%, a difference of 0.050%), Immigrants from Bangladesh (43.6%, a difference of 0.080%), Ecuadorian (43.6%, a difference of 0.15%), and Immigrants from Eritrea (43.6%, a difference of 0.18%).
| Demographics | Rating | Rank | Currently Married |
| Immigrants | Africa | 0.2 /100 | #257 | Tragic 43.9% |
| Ute | 0.2 /100 | #258 | Tragic 43.9% |
| Immigrants | Sierra Leone | 0.1 /100 | #259 | Tragic 43.8% |
| Immigrants | Latin America | 0.1 /100 | #260 | Tragic 43.8% |
| Immigrants | Nicaragua | 0.1 /100 | #261 | Tragic 43.7% |
| Bangladeshis | 0.1 /100 | #262 | Tragic 43.7% |
| Immigrants | Cuba | 0.1 /100 | #263 | Tragic 43.7% |
| Sudanese | 0.1 /100 | #264 | Tragic 43.7% |
| Immigrants | Bangladesh | 0.1 /100 | #265 | Tragic 43.6% |
| Ecuadorians | 0.1 /100 | #266 | Tragic 43.6% |
| Immigrants | Eritrea | 0.1 /100 | #267 | Tragic 43.6% |
| Spanish American Indians | 0.1 /100 | #268 | Tragic 43.6% |
| Immigrants | Sudan | 0.1 /100 | #269 | Tragic 43.5% |
| Salvadorans | 0.1 /100 | #270 | Tragic 43.5% |
| Bermudans | 0.1 /100 | #271 | Tragic 43.5% |
Demographics Similar to Mexican American Indians by Currently Married
In terms of currently married, the demographic groups most similar to Mexican American Indians are Immigrants from Mexico (44.5%, a difference of 0.0%), Ethiopian (44.5%, a difference of 0.060%), Immigrants from Cambodia (44.5%, a difference of 0.090%), Immigrants from Ethiopia (44.5%, a difference of 0.10%), and Moroccan (44.6%, a difference of 0.14%).
| Demographics | Rating | Rank | Currently Married |
| Immigrants | Saudi Arabia | 1.1 /100 | #233 | Tragic 44.7% |
| Iroquois | 1.1 /100 | #234 | Tragic 44.7% |
| Alaskan Athabascans | 0.9 /100 | #235 | Tragic 44.6% |
| Cubans | 0.9 /100 | #236 | Tragic 44.6% |
| Seminole | 0.9 /100 | #237 | Tragic 44.6% |
| Moroccans | 0.9 /100 | #238 | Tragic 44.6% |
| Immigrants | Mexico | 0.7 /100 | #239 | Tragic 44.5% |
| Mexican American Indians | 0.7 /100 | #240 | Tragic 44.5% |
| Ethiopians | 0.7 /100 | #241 | Tragic 44.5% |
| Immigrants | Cambodia | 0.7 /100 | #242 | Tragic 44.5% |
| Immigrants | Ethiopia | 0.7 /100 | #243 | Tragic 44.5% |
| Japanese | 0.6 /100 | #244 | Tragic 44.5% |
| Immigrants | Armenia | 0.4 /100 | #245 | Tragic 44.3% |
| Immigrants | Burma/Myanmar | 0.4 /100 | #246 | Tragic 44.3% |
| Ugandans | 0.4 /100 | #247 | Tragic 44.2% |