Sudanese vs Immigrants from Northern Europe Female Poverty
COMPARE
Sudanese
Immigrants from Northern Europe
Female Poverty
Female Poverty Comparison
Sudanese
Immigrants from Northern Europe
15.2%
FEMALE POVERTY
0.5/ 100
METRIC RATING
240th/ 347
METRIC RANK
11.6%
FEMALE POVERTY
99.6/ 100
METRIC RATING
25th/ 347
METRIC RANK
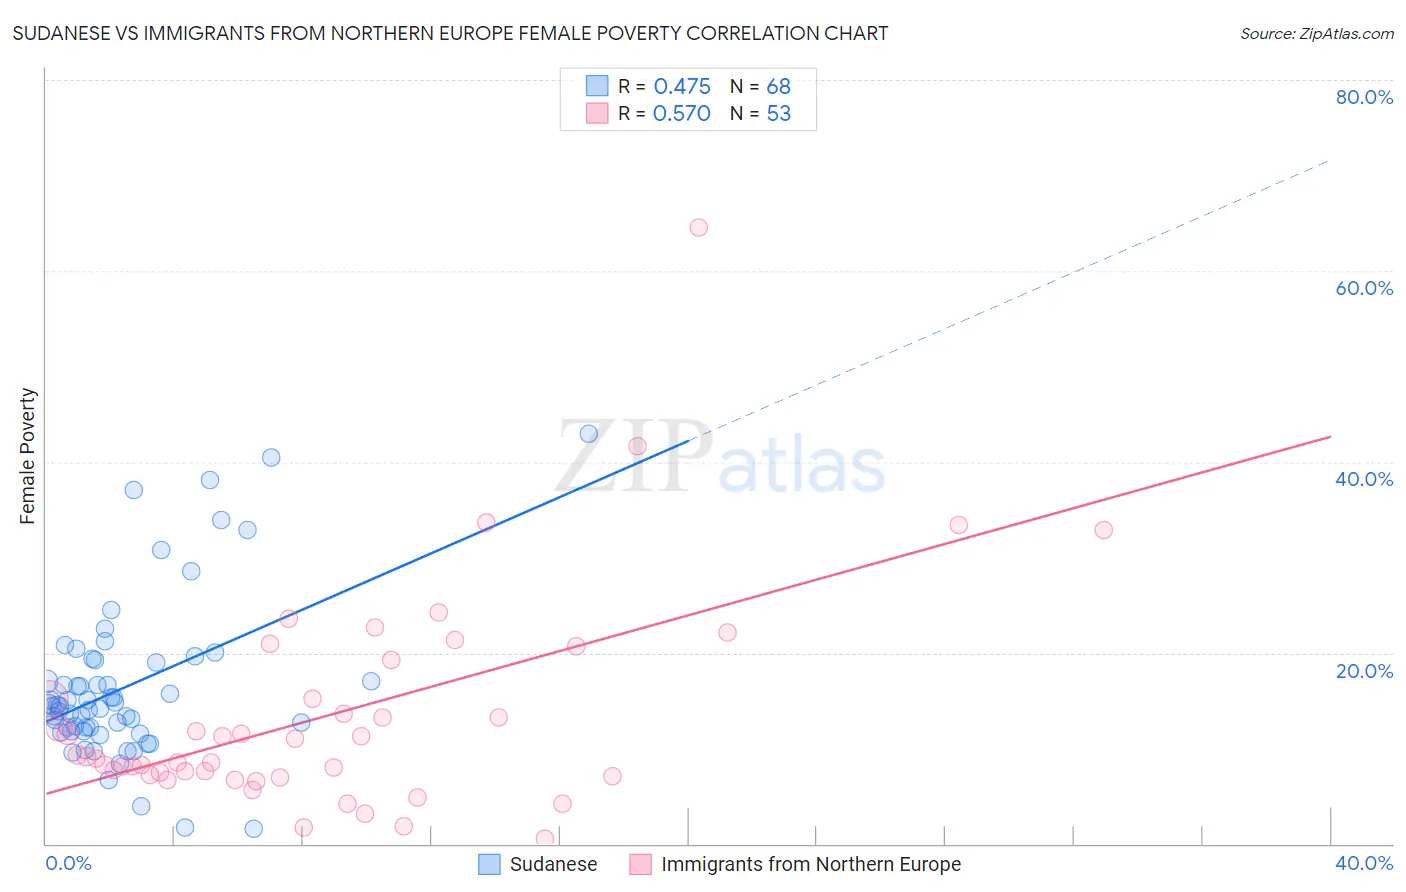
Sudanese vs Immigrants from Northern Europe Female Poverty Correlation Chart
The statistical analysis conducted on geographies consisting of 110,113,357 people shows a moderate positive correlation between the proportion of Sudanese and poverty level among females in the United States with a correlation coefficient (R) of 0.475 and weighted average of 15.2%. Similarly, the statistical analysis conducted on geographies consisting of 476,749,265 people shows a substantial positive correlation between the proportion of Immigrants from Northern Europe and poverty level among females in the United States with a correlation coefficient (R) of 0.570 and weighted average of 11.6%, a difference of 30.4%.
Female Poverty Correlation Summary
| Measurement | Sudanese | Immigrants from Northern Europe |
| Minimum | 1.6% | 0.47% |
| Maximum | 43.0% | 64.6% |
| Range | 41.4% | 64.1% |
| Mean | 16.5% | 13.5% |
| Median | 14.4% | 9.1% |
| Interquartile 25% (IQ1) | 12.0% | 7.2% |
| Interquartile 75% (IQ3) | 19.1% | 17.2% |
| Interquartile Range (IQR) | 7.1% | 10.1% |
| Standard Deviation (Sample) | 8.3% | 11.4% |
| Standard Deviation (Population) | 8.3% | 11.3% |
Similar Demographics by Female Poverty
Demographics Similar to Sudanese by Female Poverty
In terms of female poverty, the demographic groups most similar to Sudanese are Immigrants from Middle Africa (15.2%, a difference of 0.050%), Immigrants from Sudan (15.2%, a difference of 0.25%), Nepalese (15.2%, a difference of 0.37%), Immigrants from Armenia (15.1%, a difference of 0.57%), and Nicaraguan (15.3%, a difference of 0.61%).
| Demographics | Rating | Rank | Female Poverty |
| Immigrants | Saudi Arabia | 1.4 /100 | #233 | Tragic 14.8% |
| Fijians | 1.1 /100 | #234 | Tragic 14.9% |
| Immigrants | Laos | 0.9 /100 | #235 | Tragic 15.0% |
| Cree | 0.7 /100 | #236 | Tragic 15.1% |
| French American Indians | 0.6 /100 | #237 | Tragic 15.1% |
| Immigrants | Armenia | 0.6 /100 | #238 | Tragic 15.1% |
| Immigrants | Middle Africa | 0.5 /100 | #239 | Tragic 15.2% |
| Sudanese | 0.5 /100 | #240 | Tragic 15.2% |
| Immigrants | Sudan | 0.4 /100 | #241 | Tragic 15.2% |
| Nepalese | 0.4 /100 | #242 | Tragic 15.2% |
| Nicaraguans | 0.3 /100 | #243 | Tragic 15.3% |
| Ecuadorians | 0.3 /100 | #244 | Tragic 15.3% |
| Spanish American Indians | 0.3 /100 | #245 | Tragic 15.3% |
| Cubans | 0.3 /100 | #246 | Tragic 15.3% |
| Potawatomi | 0.3 /100 | #247 | Tragic 15.3% |
Demographics Similar to Immigrants from Northern Europe by Female Poverty
In terms of female poverty, the demographic groups most similar to Immigrants from Northern Europe are Croatian (11.6%, a difference of 0.0%), Iranian (11.7%, a difference of 0.11%), Luxembourger (11.6%, a difference of 0.26%), Burmese (11.6%, a difference of 0.28%), and Immigrants from Korea (11.7%, a difference of 0.32%).
| Demographics | Rating | Rank | Female Poverty |
| Immigrants | Scotland | 99.8 /100 | #18 | Exceptional 11.5% |
| Norwegians | 99.8 /100 | #19 | Exceptional 11.5% |
| Eastern Europeans | 99.7 /100 | #20 | Exceptional 11.5% |
| Italians | 99.7 /100 | #21 | Exceptional 11.6% |
| Swedes | 99.7 /100 | #22 | Exceptional 11.6% |
| Burmese | 99.7 /100 | #23 | Exceptional 11.6% |
| Luxembourgers | 99.7 /100 | #24 | Exceptional 11.6% |
| Immigrants | Northern Europe | 99.6 /100 | #25 | Exceptional 11.6% |
| Croatians | 99.6 /100 | #26 | Exceptional 11.6% |
| Iranians | 99.6 /100 | #27 | Exceptional 11.7% |
| Immigrants | Korea | 99.6 /100 | #28 | Exceptional 11.7% |
| Immigrants | North Macedonia | 99.6 /100 | #29 | Exceptional 11.7% |
| Greeks | 99.5 /100 | #30 | Exceptional 11.7% |
| Poles | 99.5 /100 | #31 | Exceptional 11.7% |
| Danes | 99.5 /100 | #32 | Exceptional 11.7% |