Immigrants from Oceania vs Spanish Family Poverty
COMPARE
Immigrants from Oceania
Spanish
Family Poverty
Family Poverty Comparison
Immigrants from Oceania
Spanish
8.7%
FAMILY POVERTY
71.2/ 100
METRIC RATING
156th/ 347
METRIC RANK
9.3%
FAMILY POVERTY
28.7/ 100
METRIC RATING
192nd/ 347
METRIC RANK
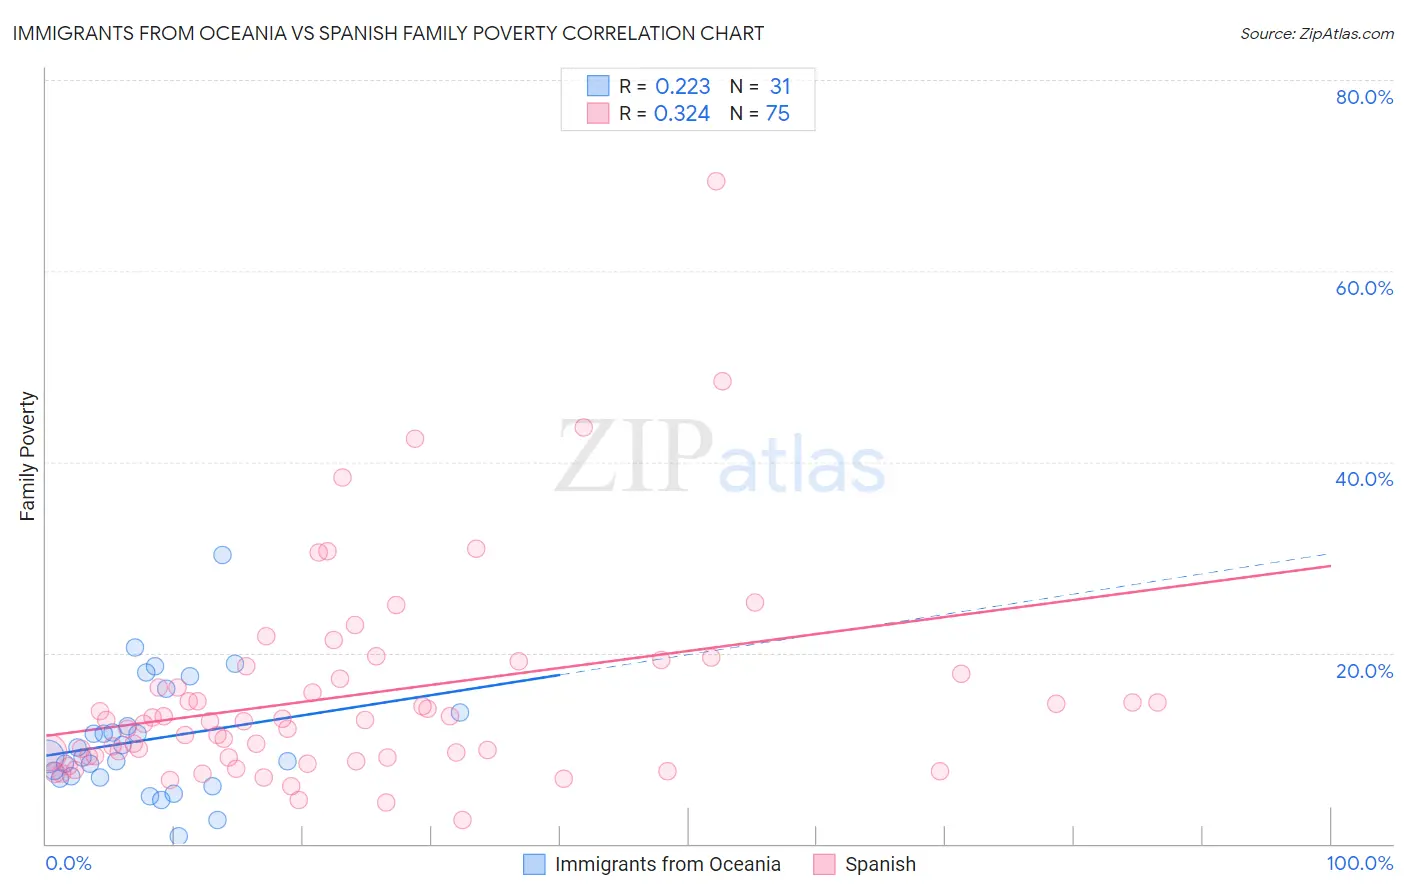
Immigrants from Oceania vs Spanish Family Poverty Correlation Chart
The statistical analysis conducted on geographies consisting of 304,831,685 people shows a weak positive correlation between the proportion of Immigrants from Oceania and poverty level among families in the United States with a correlation coefficient (R) of 0.223 and weighted average of 8.7%. Similarly, the statistical analysis conducted on geographies consisting of 421,086,812 people shows a mild positive correlation between the proportion of Spanish and poverty level among families in the United States with a correlation coefficient (R) of 0.324 and weighted average of 9.3%, a difference of 6.1%.
Family Poverty Correlation Summary
| Measurement | Immigrants from Oceania | Spanish |
| Minimum | 0.73% | 2.5% |
| Maximum | 30.3% | 69.4% |
| Range | 29.6% | 66.9% |
| Mean | 10.9% | 15.5% |
| Median | 9.1% | 12.8% |
| Interquartile 25% (IQ1) | 7.0% | 9.0% |
| Interquartile 75% (IQ3) | 13.8% | 17.8% |
| Interquartile Range (IQR) | 6.7% | 8.8% |
| Standard Deviation (Sample) | 6.1% | 11.0% |
| Standard Deviation (Population) | 6.0% | 11.0% |
Similar Demographics by Family Poverty
Demographics Similar to Immigrants from Oceania by Family Poverty
In terms of family poverty, the demographic groups most similar to Immigrants from Oceania are Tsimshian (8.8%, a difference of 0.30%), White/Caucasian (8.8%, a difference of 0.34%), Immigrants from Kuwait (8.7%, a difference of 0.40%), Peruvian (8.8%, a difference of 0.50%), and Hungarian (8.8%, a difference of 0.64%).
| Demographics | Rating | Rank | Family Poverty |
| Mongolians | 80.4 /100 | #149 | Excellent 8.6% |
| Syrians | 80.3 /100 | #150 | Excellent 8.6% |
| Brazilians | 80.1 /100 | #151 | Excellent 8.6% |
| Samoans | 79.8 /100 | #152 | Good 8.6% |
| Immigrants | Spain | 79.1 /100 | #153 | Good 8.6% |
| Immigrants | Vietnam | 75.4 /100 | #154 | Good 8.7% |
| Immigrants | Kuwait | 73.6 /100 | #155 | Good 8.7% |
| Immigrants | Oceania | 71.2 /100 | #156 | Good 8.7% |
| Tsimshian | 69.3 /100 | #157 | Good 8.8% |
| Whites/Caucasians | 69.1 /100 | #158 | Good 8.8% |
| Peruvians | 68.0 /100 | #159 | Good 8.8% |
| Hungarians | 67.2 /100 | #160 | Good 8.8% |
| Immigrants | Northern Africa | 66.9 /100 | #161 | Good 8.8% |
| Ethiopians | 66.3 /100 | #162 | Good 8.8% |
| Pennsylvania Germans | 66.0 /100 | #163 | Good 8.8% |
Demographics Similar to Spanish by Family Poverty
In terms of family poverty, the demographic groups most similar to Spanish are Ugandan (9.3%, a difference of 0.010%), Immigrants from Western Asia (9.3%, a difference of 0.070%), South American (9.3%, a difference of 0.090%), Venezuelan (9.3%, a difference of 0.21%), and Arab (9.2%, a difference of 0.42%).
| Demographics | Rating | Rank | Family Poverty |
| Immigrants | Saudi Arabia | 38.6 /100 | #185 | Fair 9.1% |
| Colombians | 36.1 /100 | #186 | Fair 9.2% |
| Delaware | 35.4 /100 | #187 | Fair 9.2% |
| Immigrants | Kenya | 34.0 /100 | #188 | Fair 9.2% |
| Immigrants | Afghanistan | 32.1 /100 | #189 | Fair 9.2% |
| Arabs | 31.5 /100 | #190 | Fair 9.2% |
| Ugandans | 28.7 /100 | #191 | Fair 9.3% |
| Spanish | 28.7 /100 | #192 | Fair 9.3% |
| Immigrants | Western Asia | 28.2 /100 | #193 | Fair 9.3% |
| South Americans | 28.1 /100 | #194 | Fair 9.3% |
| Venezuelans | 27.4 /100 | #195 | Fair 9.3% |
| Immigrants | Venezuela | 26.1 /100 | #196 | Fair 9.3% |
| Immigrants | Colombia | 24.4 /100 | #197 | Fair 9.3% |
| Iraqis | 24.2 /100 | #198 | Fair 9.3% |
| Spaniards | 22.8 /100 | #199 | Fair 9.4% |