Subsaharan African vs Spanish Disability Age Under 5
COMPARE
Subsaharan African
Spanish
Disability Age Under 5
Disability Age Under 5 Comparison
Sub-Saharan Africans
Spanish
1.3%
DISABILITY AGE UNDER 5
8.3/ 100
METRIC RATING
221st/ 347
METRIC RANK
1.4%
DISABILITY AGE UNDER 5
0.2/ 100
METRIC RATING
263rd/ 347
METRIC RANK
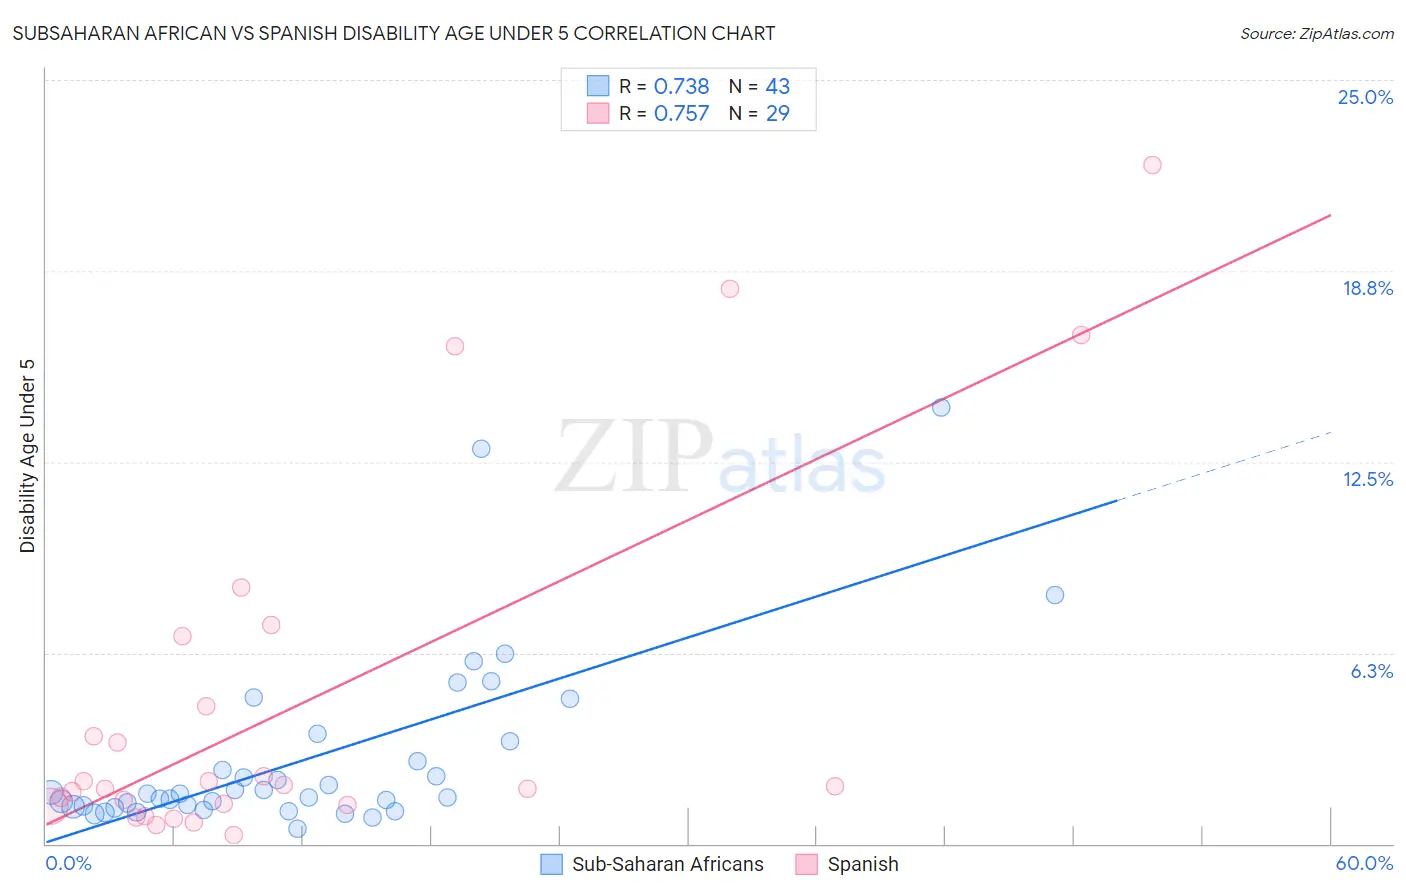
Subsaharan African vs Spanish Disability Age Under 5 Correlation Chart
The statistical analysis conducted on geographies consisting of 252,320,472 people shows a strong positive correlation between the proportion of Sub-Saharan Africans and percentage of population with a disability under the age of 5 in the United States with a correlation coefficient (R) of 0.738 and weighted average of 1.3%. Similarly, the statistical analysis conducted on geographies consisting of 226,460,629 people shows a strong positive correlation between the proportion of Spanish and percentage of population with a disability under the age of 5 in the United States with a correlation coefficient (R) of 0.757 and weighted average of 1.4%, a difference of 8.6%.
Disability Age Under 5 Correlation Summary
| Measurement | Subsaharan African | Spanish |
| Minimum | 0.47% | 0.27% |
| Maximum | 14.3% | 22.2% |
| Range | 13.8% | 21.9% |
| Mean | 2.8% | 4.6% |
| Median | 1.6% | 1.9% |
| Interquartile 25% (IQ1) | 1.2% | 1.2% |
| Interquartile 75% (IQ3) | 3.4% | 5.7% |
| Interquartile Range (IQR) | 2.1% | 4.4% |
| Standard Deviation (Sample) | 3.0% | 6.0% |
| Standard Deviation (Population) | 2.9% | 5.9% |
Similar Demographics by Disability Age Under 5
Demographics Similar to Sub-Saharan Africans by Disability Age Under 5
In terms of disability age under 5, the demographic groups most similar to Sub-Saharan Africans are Ukrainian (1.3%, a difference of 0.0%), Hispanic or Latino (1.3%, a difference of 0.19%), Serbian (1.3%, a difference of 0.34%), Latvian (1.3%, a difference of 0.35%), and Panamanian (1.3%, a difference of 0.38%).
| Demographics | Rating | Rank | Disability Age Under 5 |
| Immigrants | Chile | 17.2 /100 | #214 | Poor 1.3% |
| Syrians | 16.1 /100 | #215 | Poor 1.3% |
| Bangladeshis | 15.5 /100 | #216 | Poor 1.3% |
| Cypriots | 14.9 /100 | #217 | Poor 1.3% |
| Malaysians | 13.2 /100 | #218 | Poor 1.3% |
| Immigrants | Croatia | 11.2 /100 | #219 | Poor 1.3% |
| Serbians | 9.6 /100 | #220 | Tragic 1.3% |
| Sub-Saharan Africans | 8.3 /100 | #221 | Tragic 1.3% |
| Ukrainians | 8.3 /100 | #222 | Tragic 1.3% |
| Hispanics or Latinos | 7.7 /100 | #223 | Tragic 1.3% |
| Latvians | 7.1 /100 | #224 | Tragic 1.3% |
| Panamanians | 7.1 /100 | #225 | Tragic 1.3% |
| Bahamians | 7.1 /100 | #226 | Tragic 1.3% |
| Taiwanese | 6.1 /100 | #227 | Tragic 1.3% |
| Luxembourgers | 6.1 /100 | #228 | Tragic 1.3% |
Demographics Similar to Spanish by Disability Age Under 5
In terms of disability age under 5, the demographic groups most similar to Spanish are Immigrants from Dominica (1.4%, a difference of 0.060%), Yugoslavian (1.4%, a difference of 0.15%), Carpatho Rusyn (1.4%, a difference of 0.19%), Immigrants from Netherlands (1.4%, a difference of 0.22%), and Immigrants from Germany (1.4%, a difference of 0.22%).
| Demographics | Rating | Rank | Disability Age Under 5 |
| Immigrants | Western Europe | 0.5 /100 | #256 | Tragic 1.4% |
| Slovenes | 0.3 /100 | #257 | Tragic 1.4% |
| Costa Ricans | 0.3 /100 | #258 | Tragic 1.4% |
| Immigrants | Southern Europe | 0.3 /100 | #259 | Tragic 1.4% |
| Slavs | 0.3 /100 | #260 | Tragic 1.4% |
| Immigrants | Netherlands | 0.2 /100 | #261 | Tragic 1.4% |
| Immigrants | Dominica | 0.2 /100 | #262 | Tragic 1.4% |
| Spanish | 0.2 /100 | #263 | Tragic 1.4% |
| Yugoslavians | 0.1 /100 | #264 | Tragic 1.4% |
| Carpatho Rusyns | 0.1 /100 | #265 | Tragic 1.4% |
| Immigrants | Germany | 0.1 /100 | #266 | Tragic 1.4% |
| Cree | 0.1 /100 | #267 | Tragic 1.4% |
| Belgians | 0.1 /100 | #268 | Tragic 1.4% |
| Austrians | 0.1 /100 | #269 | Tragic 1.4% |
| Immigrants | North America | 0.1 /100 | #270 | Tragic 1.4% |