Subsaharan African vs Delaware Single Male Poverty
COMPARE
Subsaharan African
Delaware
Single Male Poverty
Single Male Poverty Comparison
Sub-Saharan Africans
Delaware
13.7%
SINGLE MALE POVERTY
0.5/ 100
METRIC RATING
254th/ 347
METRIC RANK
15.0%
SINGLE MALE POVERTY
0.0/ 100
METRIC RATING
299th/ 347
METRIC RANK
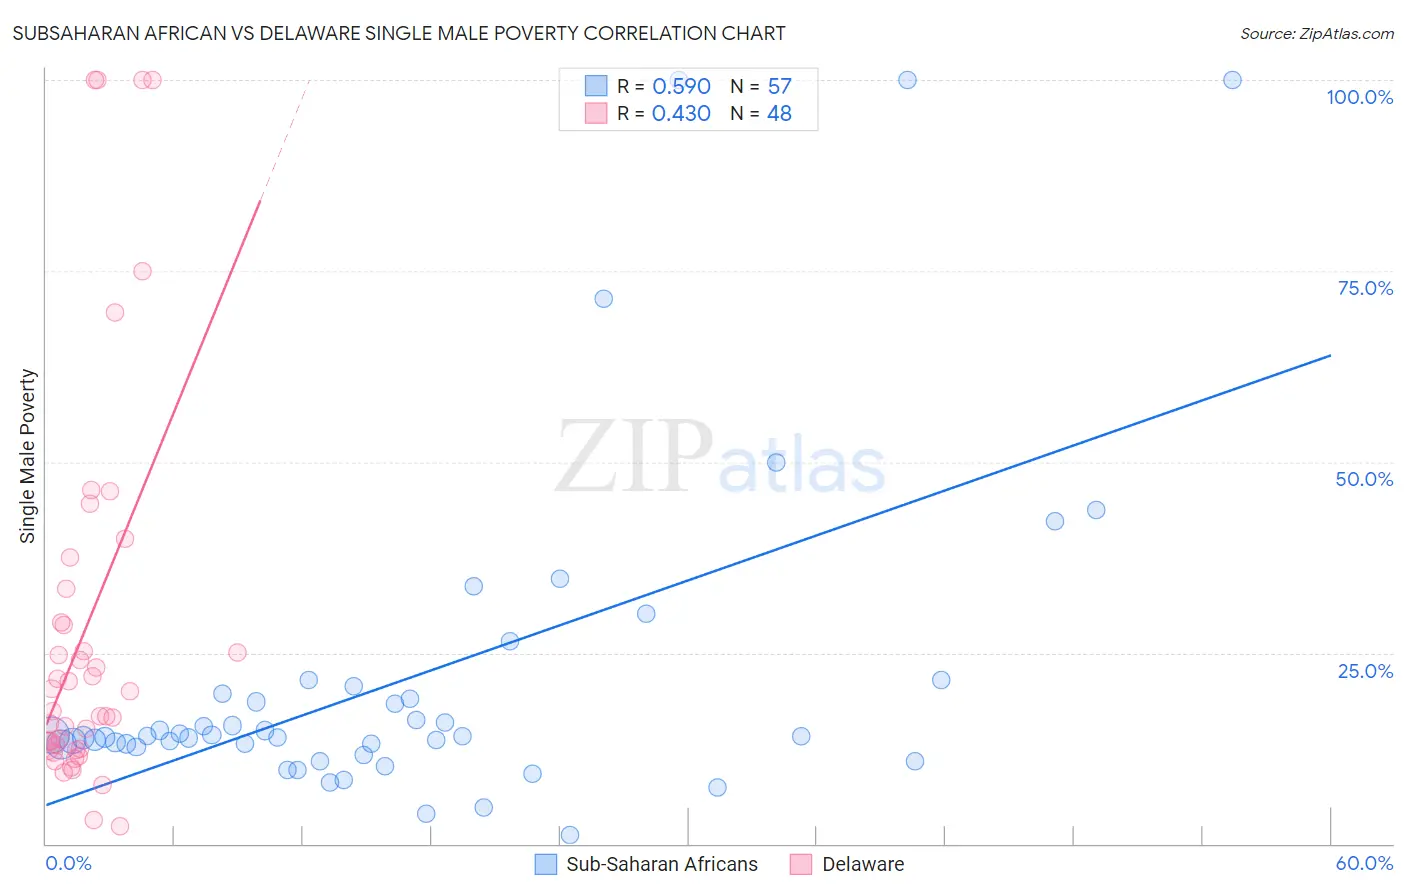
Subsaharan African vs Delaware Single Male Poverty Correlation Chart
The statistical analysis conducted on geographies consisting of 440,120,617 people shows a substantial positive correlation between the proportion of Sub-Saharan Africans and poverty level among single males in the United States with a correlation coefficient (R) of 0.590 and weighted average of 13.7%. Similarly, the statistical analysis conducted on geographies consisting of 90,922,782 people shows a moderate positive correlation between the proportion of Delaware and poverty level among single males in the United States with a correlation coefficient (R) of 0.430 and weighted average of 15.0%, a difference of 9.7%.
Single Male Poverty Correlation Summary
| Measurement | Subsaharan African | Delaware |
| Minimum | 1.1% | 2.4% |
| Maximum | 100.0% | 100.0% |
| Range | 98.9% | 97.6% |
| Mean | 21.8% | 28.5% |
| Median | 14.1% | 18.7% |
| Interquartile 25% (IQ1) | 12.8% | 12.6% |
| Interquartile 75% (IQ3) | 20.1% | 31.1% |
| Interquartile Range (IQR) | 7.3% | 18.5% |
| Standard Deviation (Sample) | 22.0% | 26.3% |
| Standard Deviation (Population) | 21.8% | 26.0% |
Similar Demographics by Single Male Poverty
Demographics Similar to Sub-Saharan Africans by Single Male Poverty
In terms of single male poverty, the demographic groups most similar to Sub-Saharan Africans are Spaniard (13.7%, a difference of 0.11%), Immigrants from Belize (13.7%, a difference of 0.21%), Immigrants from Central America (13.8%, a difference of 0.40%), Immigrants from Guatemala (13.8%, a difference of 0.47%), and Guatemalan (13.8%, a difference of 0.51%).
| Demographics | Rating | Rank | Single Male Poverty |
| Belgians | 1.2 /100 | #247 | Tragic 13.5% |
| Czechs | 1.2 /100 | #248 | Tragic 13.5% |
| Spanish | 1.0 /100 | #249 | Tragic 13.6% |
| Immigrants | Somalia | 1.0 /100 | #250 | Tragic 13.6% |
| Immigrants | Zaire | 0.9 /100 | #251 | Tragic 13.6% |
| Finns | 0.9 /100 | #252 | Tragic 13.6% |
| German Russians | 0.8 /100 | #253 | Tragic 13.6% |
| Sub-Saharan Africans | 0.5 /100 | #254 | Tragic 13.7% |
| Spaniards | 0.4 /100 | #255 | Tragic 13.7% |
| Immigrants | Belize | 0.4 /100 | #256 | Tragic 13.7% |
| Immigrants | Central America | 0.3 /100 | #257 | Tragic 13.8% |
| Immigrants | Guatemala | 0.3 /100 | #258 | Tragic 13.8% |
| Guatemalans | 0.3 /100 | #259 | Tragic 13.8% |
| Swiss | 0.3 /100 | #260 | Tragic 13.8% |
| Hungarians | 0.3 /100 | #261 | Tragic 13.8% |
Demographics Similar to Delaware by Single Male Poverty
In terms of single male poverty, the demographic groups most similar to Delaware are French American Indian (15.0%, a difference of 0.39%), Cree (15.1%, a difference of 0.45%), Dominican (15.2%, a difference of 1.3%), Alsatian (15.2%, a difference of 1.4%), and Immigrants from Dominican Republic (14.8%, a difference of 1.7%).
| Demographics | Rating | Rank | Single Male Poverty |
| Immigrants | Nonimmigrants | 0.0 /100 | #292 | Tragic 14.6% |
| French Canadians | 0.0 /100 | #293 | Tragic 14.6% |
| Ottawa | 0.0 /100 | #294 | Tragic 14.6% |
| Scotch-Irish | 0.0 /100 | #295 | Tragic 14.7% |
| Africans | 0.0 /100 | #296 | Tragic 14.7% |
| Immigrants | Dominican Republic | 0.0 /100 | #297 | Tragic 14.8% |
| French American Indians | 0.0 /100 | #298 | Tragic 15.0% |
| Delaware | 0.0 /100 | #299 | Tragic 15.0% |
| Cree | 0.0 /100 | #300 | Tragic 15.1% |
| Dominicans | 0.0 /100 | #301 | Tragic 15.2% |
| Alsatians | 0.0 /100 | #302 | Tragic 15.2% |
| Aleuts | 0.0 /100 | #303 | Tragic 15.4% |
| Alaska Natives | 0.0 /100 | #304 | Tragic 15.4% |
| Blackfeet | 0.0 /100 | #305 | Tragic 15.5% |
| Pennsylvania Germans | 0.0 /100 | #306 | Tragic 15.6% |