Subsaharan African vs Okinawan Single Male Poverty
COMPARE
Subsaharan African
Okinawan
Single Male Poverty
Single Male Poverty Comparison
Sub-Saharan Africans
Okinawans
13.7%
SINGLE MALE POVERTY
0.5/ 100
METRIC RATING
254th/ 347
METRIC RANK
12.6%
SINGLE MALE POVERTY
75.9/ 100
METRIC RATING
141st/ 347
METRIC RANK
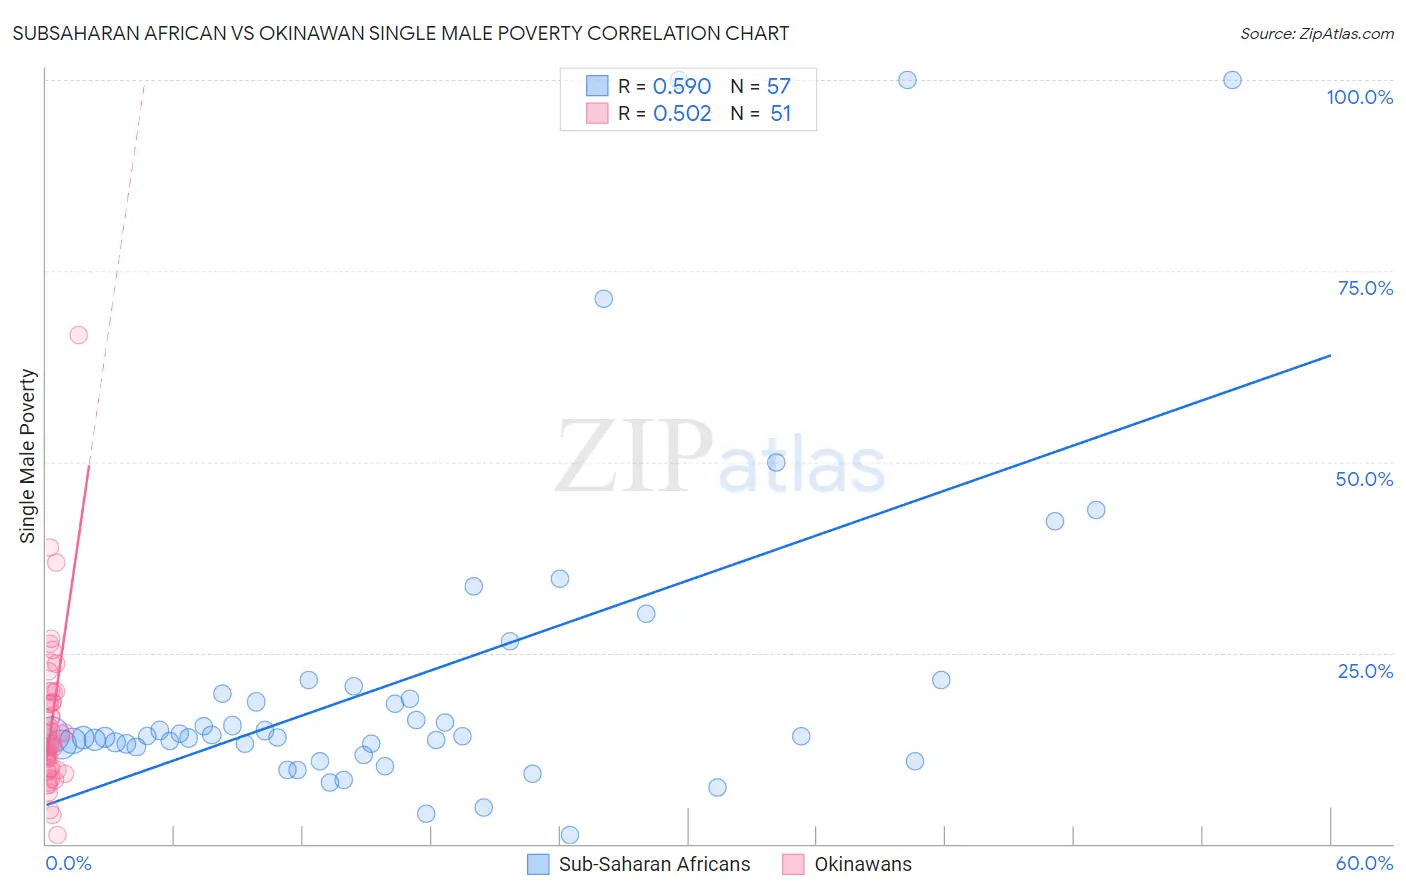
Subsaharan African vs Okinawan Single Male Poverty Correlation Chart
The statistical analysis conducted on geographies consisting of 440,120,617 people shows a substantial positive correlation between the proportion of Sub-Saharan Africans and poverty level among single males in the United States with a correlation coefficient (R) of 0.590 and weighted average of 13.7%. Similarly, the statistical analysis conducted on geographies consisting of 71,206,320 people shows a substantial positive correlation between the proportion of Okinawans and poverty level among single males in the United States with a correlation coefficient (R) of 0.502 and weighted average of 12.6%, a difference of 8.7%.
Single Male Poverty Correlation Summary
| Measurement | Subsaharan African | Okinawan |
| Minimum | 1.1% | 1.2% |
| Maximum | 100.0% | 66.7% |
| Range | 98.9% | 65.5% |
| Mean | 21.8% | 15.9% |
| Median | 14.1% | 13.2% |
| Interquartile 25% (IQ1) | 12.8% | 9.7% |
| Interquartile 75% (IQ3) | 20.1% | 19.8% |
| Interquartile Range (IQR) | 7.3% | 10.1% |
| Standard Deviation (Sample) | 22.0% | 10.4% |
| Standard Deviation (Population) | 21.8% | 10.3% |
Similar Demographics by Single Male Poverty
Demographics Similar to Sub-Saharan Africans by Single Male Poverty
In terms of single male poverty, the demographic groups most similar to Sub-Saharan Africans are Spaniard (13.7%, a difference of 0.11%), Immigrants from Belize (13.7%, a difference of 0.21%), Immigrants from Central America (13.8%, a difference of 0.40%), Immigrants from Guatemala (13.8%, a difference of 0.47%), and Guatemalan (13.8%, a difference of 0.51%).
| Demographics | Rating | Rank | Single Male Poverty |
| Belgians | 1.2 /100 | #247 | Tragic 13.5% |
| Czechs | 1.2 /100 | #248 | Tragic 13.5% |
| Spanish | 1.0 /100 | #249 | Tragic 13.6% |
| Immigrants | Somalia | 1.0 /100 | #250 | Tragic 13.6% |
| Immigrants | Zaire | 0.9 /100 | #251 | Tragic 13.6% |
| Finns | 0.9 /100 | #252 | Tragic 13.6% |
| German Russians | 0.8 /100 | #253 | Tragic 13.6% |
| Sub-Saharan Africans | 0.5 /100 | #254 | Tragic 13.7% |
| Spaniards | 0.4 /100 | #255 | Tragic 13.7% |
| Immigrants | Belize | 0.4 /100 | #256 | Tragic 13.7% |
| Immigrants | Central America | 0.3 /100 | #257 | Tragic 13.8% |
| Immigrants | Guatemala | 0.3 /100 | #258 | Tragic 13.8% |
| Guatemalans | 0.3 /100 | #259 | Tragic 13.8% |
| Swiss | 0.3 /100 | #260 | Tragic 13.8% |
| Hungarians | 0.3 /100 | #261 | Tragic 13.8% |
Demographics Similar to Okinawans by Single Male Poverty
In terms of single male poverty, the demographic groups most similar to Okinawans are Immigrants from Uganda (12.6%, a difference of 0.0%), Immigrants from France (12.6%, a difference of 0.010%), Hawaiian (12.6%, a difference of 0.060%), Immigrants from Lebanon (12.6%, a difference of 0.070%), and Native Hawaiian (12.6%, a difference of 0.070%).
| Demographics | Rating | Rank | Single Male Poverty |
| Immigrants | Ecuador | 82.1 /100 | #134 | Excellent 12.5% |
| Immigrants | Costa Rica | 81.9 /100 | #135 | Excellent 12.5% |
| Immigrants | Austria | 81.9 /100 | #136 | Excellent 12.5% |
| Ukrainians | 80.7 /100 | #137 | Excellent 12.6% |
| Immigrants | El Salvador | 80.0 /100 | #138 | Excellent 12.6% |
| Cubans | 79.9 /100 | #139 | Good 12.6% |
| Immigrants | Zimbabwe | 78.0 /100 | #140 | Good 12.6% |
| Okinawans | 75.9 /100 | #141 | Good 12.6% |
| Immigrants | Uganda | 75.9 /100 | #142 | Good 12.6% |
| Immigrants | France | 75.8 /100 | #143 | Good 12.6% |
| Hawaiians | 75.1 /100 | #144 | Good 12.6% |
| Immigrants | Lebanon | 75.0 /100 | #145 | Good 12.6% |
| Native Hawaiians | 75.0 /100 | #146 | Good 12.6% |
| Malaysians | 74.8 /100 | #147 | Good 12.6% |
| Yugoslavians | 73.9 /100 | #148 | Good 12.6% |