Subsaharan African vs Swedish Single Male Poverty
COMPARE
Subsaharan African
Swedish
Single Male Poverty
Single Male Poverty Comparison
Sub-Saharan Africans
Swedes
13.7%
SINGLE MALE POVERTY
0.5/ 100
METRIC RATING
254th/ 347
METRIC RANK
13.1%
SINGLE MALE POVERTY
16.8/ 100
METRIC RATING
211th/ 347
METRIC RANK
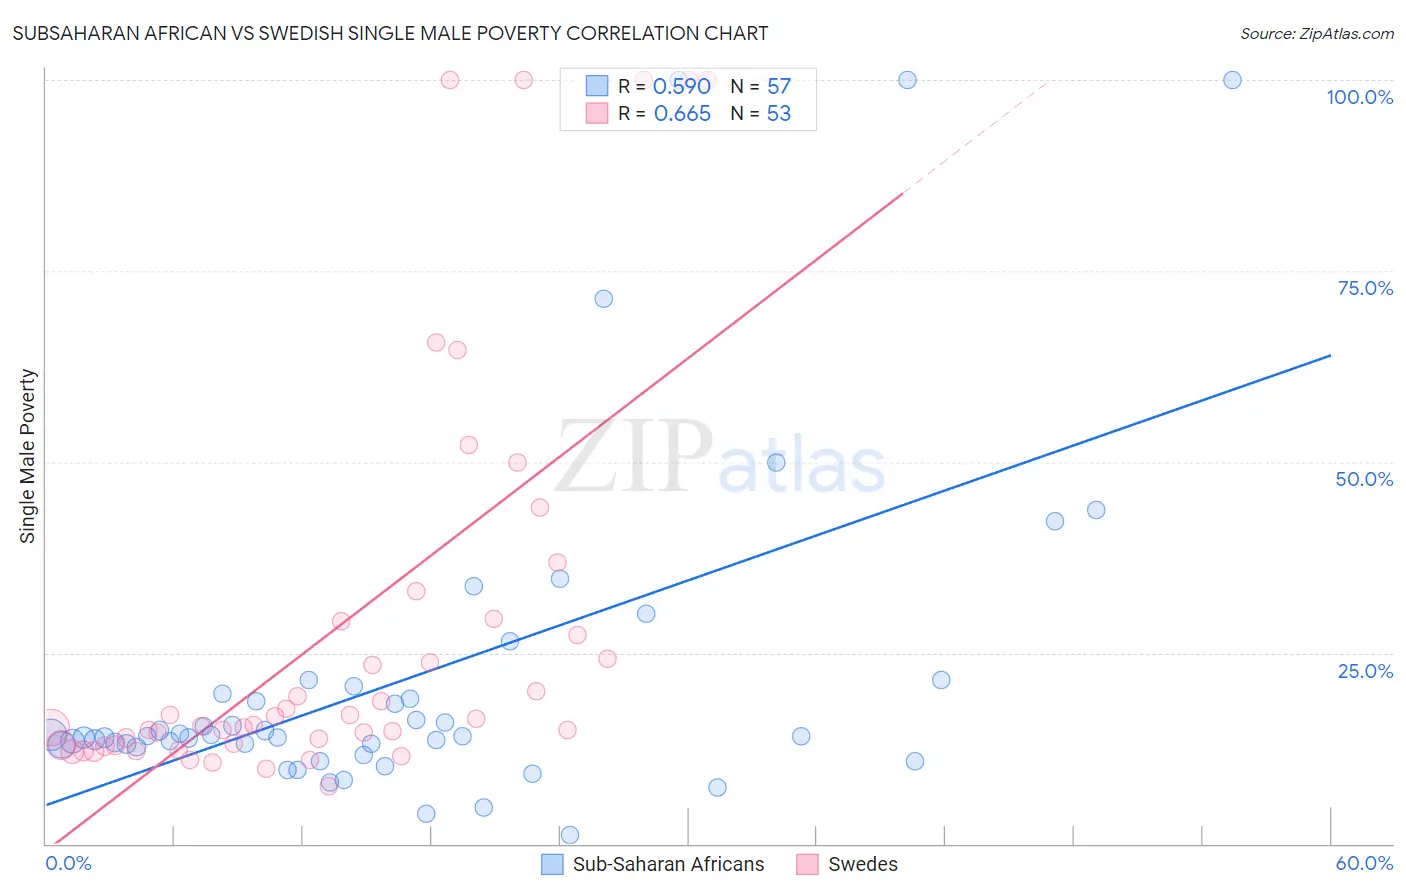
Subsaharan African vs Swedish Single Male Poverty Correlation Chart
The statistical analysis conducted on geographies consisting of 440,120,617 people shows a substantial positive correlation between the proportion of Sub-Saharan Africans and poverty level among single males in the United States with a correlation coefficient (R) of 0.590 and weighted average of 13.7%. Similarly, the statistical analysis conducted on geographies consisting of 449,246,015 people shows a significant positive correlation between the proportion of Swedes and poverty level among single males in the United States with a correlation coefficient (R) of 0.665 and weighted average of 13.1%, a difference of 4.8%.
Single Male Poverty Correlation Summary
| Measurement | Subsaharan African | Swedish |
| Minimum | 1.1% | 7.6% |
| Maximum | 100.0% | 100.0% |
| Range | 98.9% | 92.4% |
| Mean | 21.8% | 28.3% |
| Median | 14.1% | 15.6% |
| Interquartile 25% (IQ1) | 12.8% | 12.9% |
| Interquartile 75% (IQ3) | 20.1% | 29.3% |
| Interquartile Range (IQR) | 7.3% | 16.4% |
| Standard Deviation (Sample) | 22.0% | 26.7% |
| Standard Deviation (Population) | 21.8% | 26.5% |
Similar Demographics by Single Male Poverty
Demographics Similar to Sub-Saharan Africans by Single Male Poverty
In terms of single male poverty, the demographic groups most similar to Sub-Saharan Africans are Spaniard (13.7%, a difference of 0.11%), Immigrants from Belize (13.7%, a difference of 0.21%), Immigrants from Central America (13.8%, a difference of 0.40%), Immigrants from Guatemala (13.8%, a difference of 0.47%), and Guatemalan (13.8%, a difference of 0.51%).
| Demographics | Rating | Rank | Single Male Poverty |
| Belgians | 1.2 /100 | #247 | Tragic 13.5% |
| Czechs | 1.2 /100 | #248 | Tragic 13.5% |
| Spanish | 1.0 /100 | #249 | Tragic 13.6% |
| Immigrants | Somalia | 1.0 /100 | #250 | Tragic 13.6% |
| Immigrants | Zaire | 0.9 /100 | #251 | Tragic 13.6% |
| Finns | 0.9 /100 | #252 | Tragic 13.6% |
| German Russians | 0.8 /100 | #253 | Tragic 13.6% |
| Sub-Saharan Africans | 0.5 /100 | #254 | Tragic 13.7% |
| Spaniards | 0.4 /100 | #255 | Tragic 13.7% |
| Immigrants | Belize | 0.4 /100 | #256 | Tragic 13.7% |
| Immigrants | Central America | 0.3 /100 | #257 | Tragic 13.8% |
| Immigrants | Guatemala | 0.3 /100 | #258 | Tragic 13.8% |
| Guatemalans | 0.3 /100 | #259 | Tragic 13.8% |
| Swiss | 0.3 /100 | #260 | Tragic 13.8% |
| Hungarians | 0.3 /100 | #261 | Tragic 13.8% |
Demographics Similar to Swedes by Single Male Poverty
In terms of single male poverty, the demographic groups most similar to Swedes are Immigrants from Haiti (13.1%, a difference of 0.010%), Senegalese (13.1%, a difference of 0.030%), Mexican American Indian (13.1%, a difference of 0.060%), Sudanese (13.1%, a difference of 0.080%), and Immigrants from Western Africa (13.1%, a difference of 0.080%).
| Demographics | Rating | Rank | Single Male Poverty |
| Estonians | 20.3 /100 | #204 | Fair 13.0% |
| Poles | 19.3 /100 | #205 | Poor 13.0% |
| Northern Europeans | 18.9 /100 | #206 | Poor 13.0% |
| Sudanese | 17.7 /100 | #207 | Poor 13.1% |
| Immigrants | Western Africa | 17.6 /100 | #208 | Poor 13.1% |
| Mexican American Indians | 17.5 /100 | #209 | Poor 13.1% |
| Immigrants | Haiti | 16.8 /100 | #210 | Poor 13.1% |
| Swedes | 16.8 /100 | #211 | Poor 13.1% |
| Senegalese | 16.4 /100 | #212 | Poor 13.1% |
| Italians | 15.9 /100 | #213 | Poor 13.1% |
| Zimbabweans | 14.9 /100 | #214 | Poor 13.1% |
| Japanese | 14.8 /100 | #215 | Poor 13.1% |
| Austrians | 13.9 /100 | #216 | Poor 13.1% |
| Bermudans | 13.0 /100 | #217 | Poor 13.1% |
| Scandinavians | 12.9 /100 | #218 | Poor 13.1% |