Subsaharan African vs Cuban Single Mother Poverty
COMPARE
Subsaharan African
Cuban
Single Mother Poverty
Single Mother Poverty Comparison
Sub-Saharan Africans
Cubans
31.4%
SINGLE MOTHER POVERTY
0.2/ 100
METRIC RATING
266th/ 347
METRIC RANK
29.6%
SINGLE MOTHER POVERTY
20.8/ 100
METRIC RATING
199th/ 347
METRIC RANK
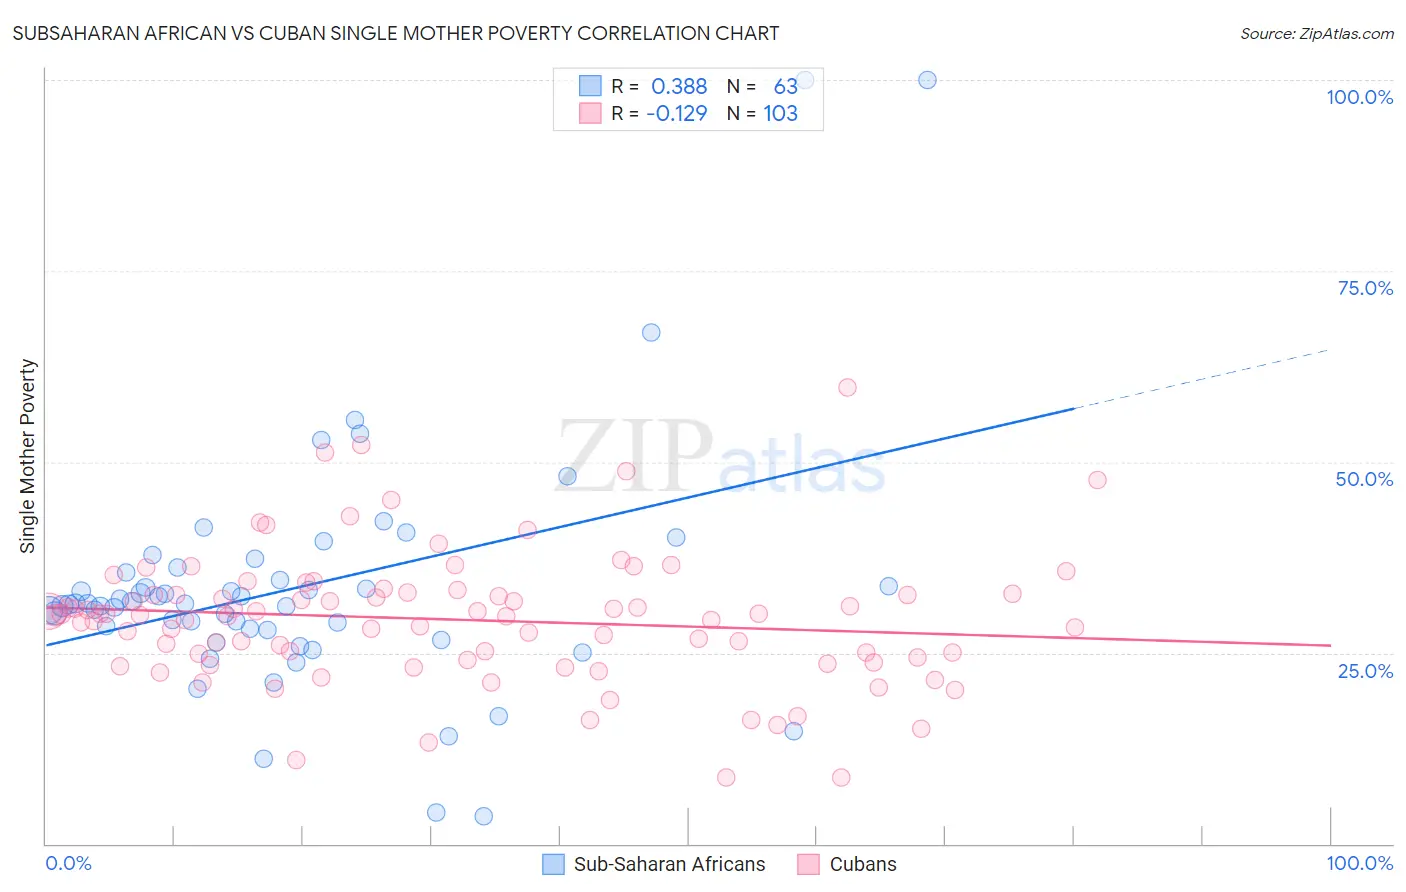
Subsaharan African vs Cuban Single Mother Poverty Correlation Chart
The statistical analysis conducted on geographies consisting of 493,508,844 people shows a mild positive correlation between the proportion of Sub-Saharan Africans and poverty level among single mothers in the United States with a correlation coefficient (R) of 0.388 and weighted average of 31.4%. Similarly, the statistical analysis conducted on geographies consisting of 437,360,929 people shows a poor negative correlation between the proportion of Cubans and poverty level among single mothers in the United States with a correlation coefficient (R) of -0.129 and weighted average of 29.6%, a difference of 5.8%.
Single Mother Poverty Correlation Summary
| Measurement | Subsaharan African | Cuban |
| Minimum | 3.7% | 8.7% |
| Maximum | 100.0% | 59.8% |
| Range | 96.3% | 51.1% |
| Mean | 33.5% | 29.3% |
| Median | 31.4% | 29.9% |
| Interquartile 25% (IQ1) | 28.1% | 24.0% |
| Interquartile 75% (IQ3) | 35.5% | 32.7% |
| Interquartile Range (IQR) | 7.4% | 8.7% |
| Standard Deviation (Sample) | 16.1% | 8.7% |
| Standard Deviation (Population) | 16.0% | 8.7% |
Similar Demographics by Single Mother Poverty
Demographics Similar to Sub-Saharan Africans by Single Mother Poverty
In terms of single mother poverty, the demographic groups most similar to Sub-Saharan Africans are German Russian (31.3%, a difference of 0.070%), Immigrants from Ecuador (31.3%, a difference of 0.090%), Bahamian (31.3%, a difference of 0.11%), Immigrants from Belize (31.4%, a difference of 0.15%), and Immigrants from Senegal (31.5%, a difference of 0.33%).
| Demographics | Rating | Rank | Single Mother Poverty |
| Immigrants | Bangladesh | 0.4 /100 | #259 | Tragic 31.1% |
| Whites/Caucasians | 0.3 /100 | #260 | Tragic 31.2% |
| Immigrants | El Salvador | 0.3 /100 | #261 | Tragic 31.2% |
| Hmong | 0.3 /100 | #262 | Tragic 31.2% |
| Bahamians | 0.2 /100 | #263 | Tragic 31.3% |
| Immigrants | Ecuador | 0.2 /100 | #264 | Tragic 31.3% |
| German Russians | 0.2 /100 | #265 | Tragic 31.3% |
| Sub-Saharan Africans | 0.2 /100 | #266 | Tragic 31.4% |
| Immigrants | Belize | 0.2 /100 | #267 | Tragic 31.4% |
| Immigrants | Senegal | 0.1 /100 | #268 | Tragic 31.5% |
| Scotch-Irish | 0.1 /100 | #269 | Tragic 31.5% |
| British West Indians | 0.1 /100 | #270 | Tragic 31.5% |
| Immigrants | Cabo Verde | 0.1 /100 | #271 | Tragic 31.6% |
| Immigrants | Micronesia | 0.1 /100 | #272 | Tragic 31.6% |
| Fijians | 0.1 /100 | #273 | Tragic 31.6% |
Demographics Similar to Cubans by Single Mother Poverty
In terms of single mother poverty, the demographic groups most similar to Cubans are Panamanian (29.6%, a difference of 0.050%), Trinidadian and Tobagonian (29.6%, a difference of 0.070%), Immigrants from Jamaica (29.6%, a difference of 0.080%), Belgian (29.7%, a difference of 0.15%), and Spanish American Indian (29.6%, a difference of 0.18%).
| Demographics | Rating | Rank | Single Mother Poverty |
| Moroccans | 28.6 /100 | #192 | Fair 29.5% |
| Basques | 28.3 /100 | #193 | Fair 29.5% |
| Icelanders | 26.1 /100 | #194 | Fair 29.5% |
| Slavs | 24.5 /100 | #195 | Fair 29.6% |
| Spanish American Indians | 23.4 /100 | #196 | Fair 29.6% |
| Immigrants | Jamaica | 22.0 /100 | #197 | Fair 29.6% |
| Trinidadians and Tobagonians | 21.7 /100 | #198 | Fair 29.6% |
| Cubans | 20.8 /100 | #199 | Fair 29.6% |
| Panamanians | 20.0 /100 | #200 | Fair 29.6% |
| Belgians | 18.8 /100 | #201 | Poor 29.7% |
| Malaysians | 17.4 /100 | #202 | Poor 29.7% |
| Swiss | 17.2 /100 | #203 | Poor 29.7% |
| Immigrants | Immigrants | 16.6 /100 | #204 | Poor 29.7% |
| Czechoslovakians | 16.1 /100 | #205 | Poor 29.7% |
| Immigrants | Haiti | 15.8 /100 | #206 | Poor 29.7% |