Subsaharan African vs Spaniard Single Mother Poverty
COMPARE
Subsaharan African
Spaniard
Single Mother Poverty
Single Mother Poverty Comparison
Sub-Saharan Africans
Spaniards
31.4%
SINGLE MOTHER POVERTY
0.2/ 100
METRIC RATING
266th/ 347
METRIC RANK
30.2%
SINGLE MOTHER POVERTY
5.4/ 100
METRIC RATING
228th/ 347
METRIC RANK
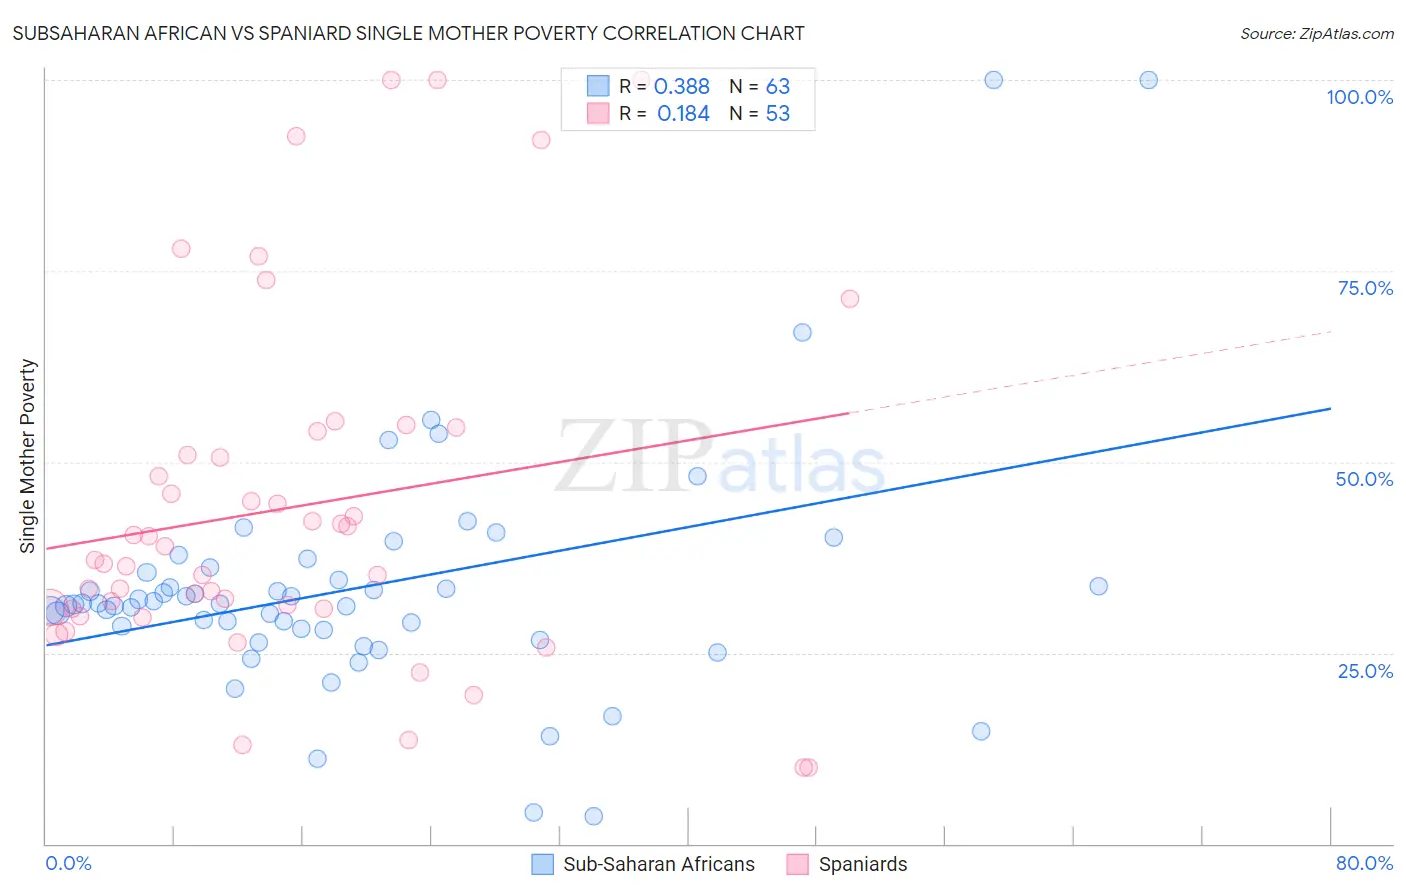
Subsaharan African vs Spaniard Single Mother Poverty Correlation Chart
The statistical analysis conducted on geographies consisting of 493,508,844 people shows a mild positive correlation between the proportion of Sub-Saharan Africans and poverty level among single mothers in the United States with a correlation coefficient (R) of 0.388 and weighted average of 31.4%. Similarly, the statistical analysis conducted on geographies consisting of 431,071,159 people shows a poor positive correlation between the proportion of Spaniards and poverty level among single mothers in the United States with a correlation coefficient (R) of 0.184 and weighted average of 30.2%, a difference of 4.0%.
Single Mother Poverty Correlation Summary
| Measurement | Subsaharan African | Spaniard |
| Minimum | 3.7% | 10.0% |
| Maximum | 100.0% | 100.0% |
| Range | 96.3% | 90.0% |
| Mean | 33.5% | 44.0% |
| Median | 31.4% | 37.1% |
| Interquartile 25% (IQ1) | 28.1% | 30.8% |
| Interquartile 75% (IQ3) | 35.5% | 52.5% |
| Interquartile Range (IQR) | 7.4% | 21.7% |
| Standard Deviation (Sample) | 16.1% | 22.9% |
| Standard Deviation (Population) | 16.0% | 22.7% |
Similar Demographics by Single Mother Poverty
Demographics Similar to Sub-Saharan Africans by Single Mother Poverty
In terms of single mother poverty, the demographic groups most similar to Sub-Saharan Africans are German Russian (31.3%, a difference of 0.070%), Immigrants from Ecuador (31.3%, a difference of 0.090%), Bahamian (31.3%, a difference of 0.11%), Immigrants from Belize (31.4%, a difference of 0.15%), and Immigrants from Senegal (31.5%, a difference of 0.33%).
| Demographics | Rating | Rank | Single Mother Poverty |
| Immigrants | Bangladesh | 0.4 /100 | #259 | Tragic 31.1% |
| Whites/Caucasians | 0.3 /100 | #260 | Tragic 31.2% |
| Immigrants | El Salvador | 0.3 /100 | #261 | Tragic 31.2% |
| Hmong | 0.3 /100 | #262 | Tragic 31.2% |
| Bahamians | 0.2 /100 | #263 | Tragic 31.3% |
| Immigrants | Ecuador | 0.2 /100 | #264 | Tragic 31.3% |
| German Russians | 0.2 /100 | #265 | Tragic 31.3% |
| Sub-Saharan Africans | 0.2 /100 | #266 | Tragic 31.4% |
| Immigrants | Belize | 0.2 /100 | #267 | Tragic 31.4% |
| Immigrants | Senegal | 0.1 /100 | #268 | Tragic 31.5% |
| Scotch-Irish | 0.1 /100 | #269 | Tragic 31.5% |
| British West Indians | 0.1 /100 | #270 | Tragic 31.5% |
| Immigrants | Cabo Verde | 0.1 /100 | #271 | Tragic 31.6% |
| Immigrants | Micronesia | 0.1 /100 | #272 | Tragic 31.6% |
| Fijians | 0.1 /100 | #273 | Tragic 31.6% |
Demographics Similar to Spaniards by Single Mother Poverty
In terms of single mother poverty, the demographic groups most similar to Spaniards are Immigrants from Barbados (30.2%, a difference of 0.090%), Immigrants from Liberia (30.1%, a difference of 0.11%), English (30.2%, a difference of 0.13%), Scottish (30.1%, a difference of 0.14%), and Spanish (30.1%, a difference of 0.20%).
| Demographics | Rating | Rank | Single Mother Poverty |
| Immigrants | Eritrea | 7.7 /100 | #221 | Tragic 30.0% |
| Sudanese | 7.6 /100 | #222 | Tragic 30.0% |
| Immigrants | Cuba | 6.9 /100 | #223 | Tragic 30.1% |
| Immigrants | Sudan | 6.5 /100 | #224 | Tragic 30.1% |
| Spanish | 6.3 /100 | #225 | Tragic 30.1% |
| Scottish | 6.0 /100 | #226 | Tragic 30.1% |
| Immigrants | Liberia | 5.9 /100 | #227 | Tragic 30.1% |
| Spaniards | 5.4 /100 | #228 | Tragic 30.2% |
| Immigrants | Barbados | 5.0 /100 | #229 | Tragic 30.2% |
| English | 4.8 /100 | #230 | Tragic 30.2% |
| Dutch | 4.3 /100 | #231 | Tragic 30.2% |
| Alaskan Athabascans | 4.1 /100 | #232 | Tragic 30.3% |
| Immigrants | Middle Africa | 3.5 /100 | #233 | Tragic 30.3% |
| Immigrants | Nicaragua | 3.5 /100 | #234 | Tragic 30.3% |
| Immigrants | Grenada | 3.4 /100 | #235 | Tragic 30.3% |