Scottish vs Guamanian/Chamorro Child Poverty Among Boys Under 16
COMPARE
Scottish
Guamanian/Chamorro
Child Poverty Among Boys Under 16
Child Poverty Among Boys Under 16 Comparison
Scottish
Guamanians/Chamorros
15.2%
CHILD POVERTY AMONG BOYS UNDER 16
93.0/ 100
METRIC RATING
121st/ 347
METRIC RANK
16.1%
CHILD POVERTY AMONG BOYS UNDER 16
69.6/ 100
METRIC RATING
162nd/ 347
METRIC RANK
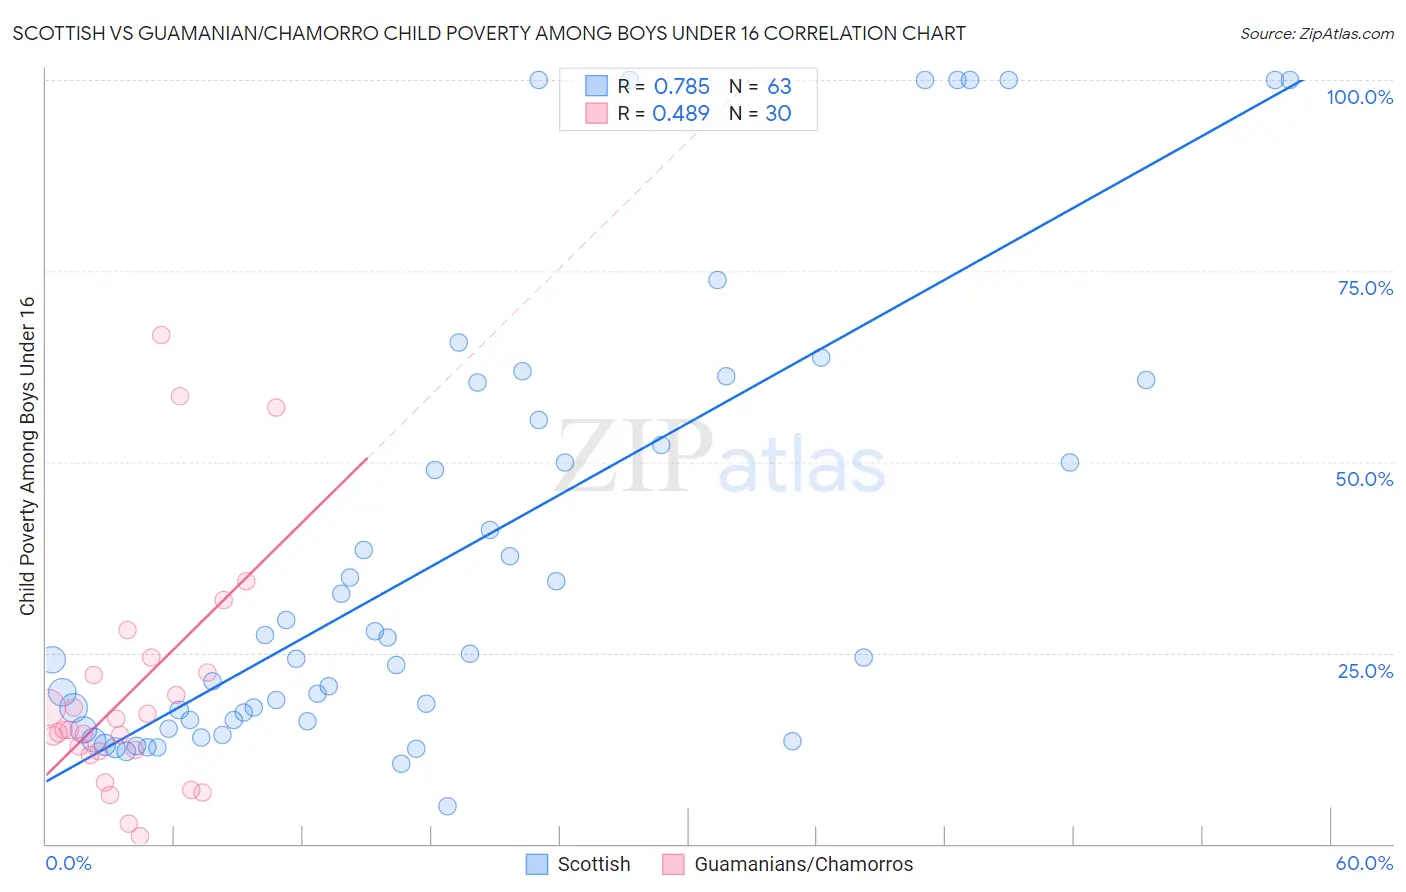
Scottish vs Guamanian/Chamorro Child Poverty Among Boys Under 16 Correlation Chart
The statistical analysis conducted on geographies consisting of 546,371,305 people shows a strong positive correlation between the proportion of Scottish and poverty level among boys under the age of 16 in the United States with a correlation coefficient (R) of 0.785 and weighted average of 15.2%. Similarly, the statistical analysis conducted on geographies consisting of 220,488,068 people shows a moderate positive correlation between the proportion of Guamanians/Chamorros and poverty level among boys under the age of 16 in the United States with a correlation coefficient (R) of 0.489 and weighted average of 16.1%, a difference of 5.3%.
Child Poverty Among Boys Under 16 Correlation Summary
| Measurement | Scottish | Guamanian/Chamorro |
| Minimum | 5.0% | 1.0% |
| Maximum | 100.0% | 66.7% |
| Range | 95.0% | 65.6% |
| Mean | 37.8% | 20.1% |
| Median | 24.3% | 14.9% |
| Interquartile 25% (IQ1) | 16.0% | 12.0% |
| Interquartile 75% (IQ3) | 55.6% | 22.4% |
| Interquartile Range (IQR) | 39.5% | 10.3% |
| Standard Deviation (Sample) | 29.2% | 15.8% |
| Standard Deviation (Population) | 29.0% | 15.6% |
Similar Demographics by Child Poverty Among Boys Under 16
Demographics Similar to Scottish by Child Poverty Among Boys Under 16
In terms of child poverty among boys under 16, the demographic groups most similar to Scottish are South African (15.2%, a difference of 0.010%), Belgian (15.2%, a difference of 0.060%), Immigrants from Malaysia (15.3%, a difference of 0.10%), Native Hawaiian (15.2%, a difference of 0.18%), and Immigrants from Vietnam (15.2%, a difference of 0.24%).
| Demographics | Rating | Rank | Child Poverty Among Boys Under 16 |
| Immigrants | Ukraine | 93.6 /100 | #114 | Exceptional 15.2% |
| Armenians | 93.6 /100 | #115 | Exceptional 15.2% |
| Immigrants | South Eastern Asia | 93.5 /100 | #116 | Exceptional 15.2% |
| Immigrants | Vietnam | 93.5 /100 | #117 | Exceptional 15.2% |
| Native Hawaiians | 93.4 /100 | #118 | Exceptional 15.2% |
| Belgians | 93.1 /100 | #119 | Exceptional 15.2% |
| South Africans | 93.0 /100 | #120 | Exceptional 15.2% |
| Scottish | 93.0 /100 | #121 | Exceptional 15.2% |
| Immigrants | Malaysia | 92.8 /100 | #122 | Exceptional 15.3% |
| Immigrants | Norway | 92.3 /100 | #123 | Exceptional 15.3% |
| Tlingit-Haida | 92.2 /100 | #124 | Exceptional 15.3% |
| Czechoslovakians | 92.1 /100 | #125 | Exceptional 15.3% |
| Palestinians | 91.3 /100 | #126 | Exceptional 15.4% |
| Carpatho Rusyns | 91.1 /100 | #127 | Exceptional 15.4% |
| Canadians | 90.6 /100 | #128 | Exceptional 15.4% |
Demographics Similar to Guamanians/Chamorros by Child Poverty Among Boys Under 16
In terms of child poverty among boys under 16, the demographic groups most similar to Guamanians/Chamorros are Costa Rican (16.1%, a difference of 0.20%), Immigrants from Albania (16.1%, a difference of 0.22%), Immigrants from Oceania (16.0%, a difference of 0.23%), Immigrants from Northern Africa (16.0%, a difference of 0.24%), and Colombian (16.1%, a difference of 0.58%).
| Demographics | Rating | Rank | Child Poverty Among Boys Under 16 |
| French Canadians | 76.6 /100 | #155 | Good 15.9% |
| Israelis | 76.5 /100 | #156 | Good 15.9% |
| Immigrants | Nepal | 76.0 /100 | #157 | Good 15.9% |
| Yugoslavians | 75.9 /100 | #158 | Good 15.9% |
| Immigrants | Chile | 74.8 /100 | #159 | Good 15.9% |
| Immigrants | Northern Africa | 71.3 /100 | #160 | Good 16.0% |
| Immigrants | Oceania | 71.3 /100 | #161 | Good 16.0% |
| Guamanians/Chamorros | 69.6 /100 | #162 | Good 16.1% |
| Costa Ricans | 68.1 /100 | #163 | Good 16.1% |
| Immigrants | Albania | 67.9 /100 | #164 | Good 16.1% |
| Colombians | 65.2 /100 | #165 | Good 16.1% |
| Immigrants | Germany | 63.6 /100 | #166 | Good 16.2% |
| Afghans | 55.4 /100 | #167 | Average 16.3% |
| South Americans | 55.3 /100 | #168 | Average 16.3% |
| Immigrants | Saudi Arabia | 53.6 /100 | #169 | Average 16.4% |