Immigrants from Syria vs Guamanian/Chamorro Child Poverty Among Boys Under 16
COMPARE
Immigrants from Syria
Guamanian/Chamorro
Child Poverty Among Boys Under 16
Child Poverty Among Boys Under 16 Comparison
Immigrants from Syria
Guamanians/Chamorros
16.5%
CHILD POVERTY AMONG BOYS UNDER 16
49.0/ 100
METRIC RATING
175th/ 347
METRIC RANK
16.1%
CHILD POVERTY AMONG BOYS UNDER 16
69.6/ 100
METRIC RATING
162nd/ 347
METRIC RANK
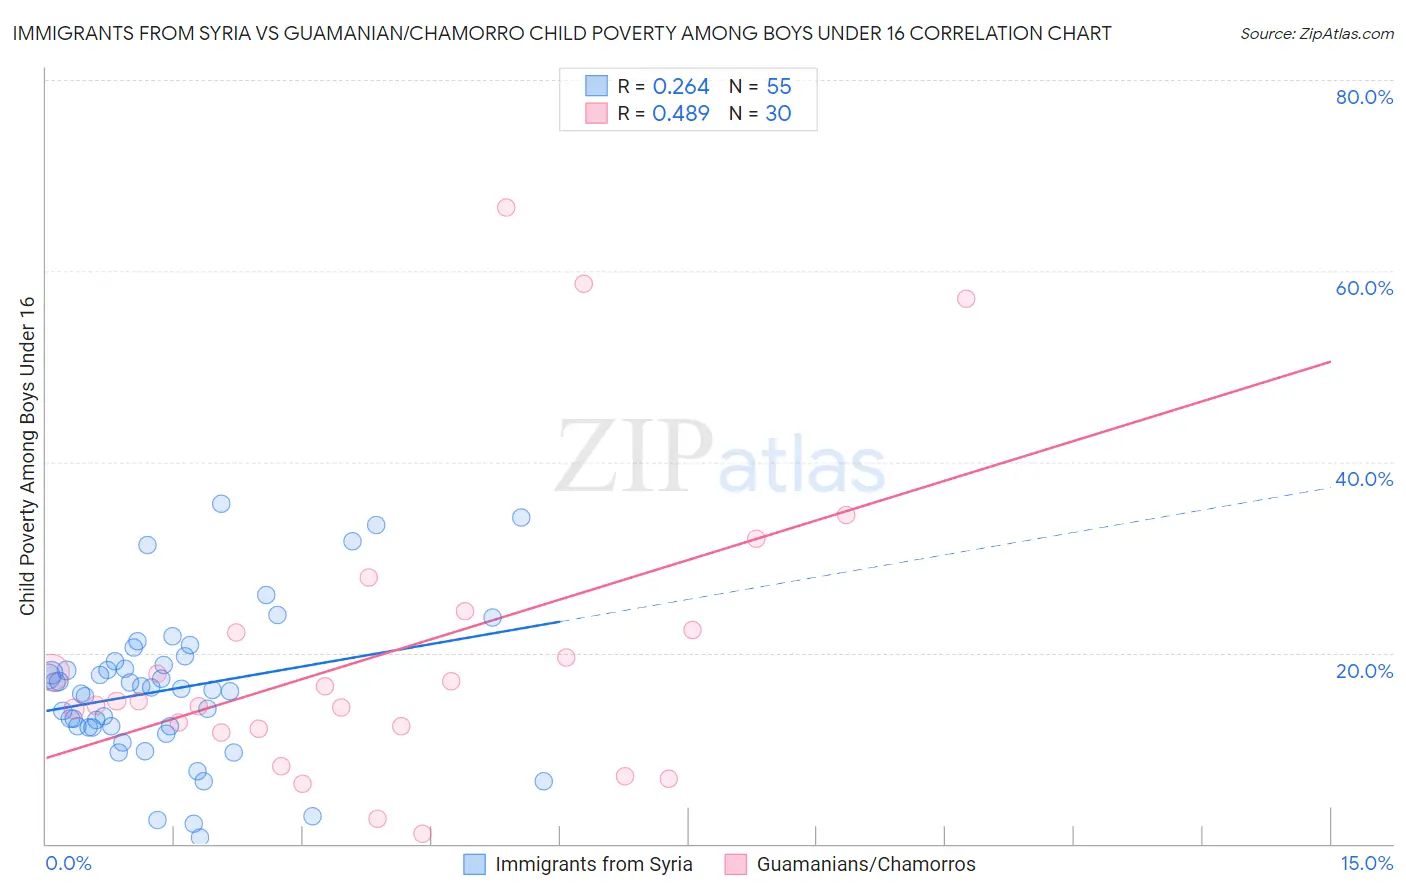
Immigrants from Syria vs Guamanian/Chamorro Child Poverty Among Boys Under 16 Correlation Chart
The statistical analysis conducted on geographies consisting of 173,156,396 people shows a weak positive correlation between the proportion of Immigrants from Syria and poverty level among boys under the age of 16 in the United States with a correlation coefficient (R) of 0.264 and weighted average of 16.5%. Similarly, the statistical analysis conducted on geographies consisting of 220,488,068 people shows a moderate positive correlation between the proportion of Guamanians/Chamorros and poverty level among boys under the age of 16 in the United States with a correlation coefficient (R) of 0.489 and weighted average of 16.1%, a difference of 2.5%.
Child Poverty Among Boys Under 16 Correlation Summary
| Measurement | Immigrants from Syria | Guamanian/Chamorro |
| Minimum | 0.70% | 1.0% |
| Maximum | 35.6% | 66.7% |
| Range | 34.9% | 65.6% |
| Mean | 16.2% | 20.1% |
| Median | 16.2% | 14.9% |
| Interquartile 25% (IQ1) | 12.2% | 12.0% |
| Interquartile 75% (IQ3) | 19.2% | 22.4% |
| Interquartile Range (IQR) | 7.0% | 10.3% |
| Standard Deviation (Sample) | 7.7% | 15.8% |
| Standard Deviation (Population) | 7.6% | 15.6% |
Demographics Similar to Immigrants from Syria and Guamanians/Chamorros by Child Poverty Among Boys Under 16
In terms of child poverty among boys under 16, the demographic groups most similar to Immigrants from Syria are White/Caucasian (16.5%, a difference of 0.090%), Uruguayan (16.4%, a difference of 0.11%), Ethiopian (16.5%, a difference of 0.14%), Tsimshian (16.4%, a difference of 0.16%), and Scotch-Irish (16.5%, a difference of 0.17%). Similarly, the demographic groups most similar to Guamanians/Chamorros are Costa Rican (16.1%, a difference of 0.20%), Immigrants from Albania (16.1%, a difference of 0.22%), Immigrants from Oceania (16.0%, a difference of 0.23%), Immigrants from Northern Africa (16.0%, a difference of 0.24%), and Colombian (16.1%, a difference of 0.58%).
| Demographics | Rating | Rank | Child Poverty Among Boys Under 16 |
| Yugoslavians | 75.9 /100 | #158 | Good 15.9% |
| Immigrants | Chile | 74.8 /100 | #159 | Good 15.9% |
| Immigrants | Northern Africa | 71.3 /100 | #160 | Good 16.0% |
| Immigrants | Oceania | 71.3 /100 | #161 | Good 16.0% |
| Guamanians/Chamorros | 69.6 /100 | #162 | Good 16.1% |
| Costa Ricans | 68.1 /100 | #163 | Good 16.1% |
| Immigrants | Albania | 67.9 /100 | #164 | Good 16.1% |
| Colombians | 65.2 /100 | #165 | Good 16.1% |
| Immigrants | Germany | 63.6 /100 | #166 | Good 16.2% |
| Afghans | 55.4 /100 | #167 | Average 16.3% |
| South Americans | 55.3 /100 | #168 | Average 16.3% |
| Immigrants | Saudi Arabia | 53.6 /100 | #169 | Average 16.4% |
| Immigrants | Bosnia and Herzegovina | 51.7 /100 | #170 | Average 16.4% |
| Immigrants | Ethiopia | 51.3 /100 | #171 | Average 16.4% |
| Immigrants | Colombia | 50.8 /100 | #172 | Average 16.4% |
| Tsimshian | 50.5 /100 | #173 | Average 16.4% |
| Uruguayans | 50.0 /100 | #174 | Average 16.4% |
| Immigrants | Syria | 49.0 /100 | #175 | Average 16.5% |
| Whites/Caucasians | 48.2 /100 | #176 | Average 16.5% |
| Ethiopians | 47.8 /100 | #177 | Average 16.5% |
| Scotch-Irish | 47.5 /100 | #178 | Average 16.5% |