Spanish vs Cambodian Child Poverty Among Girls Under 16
COMPARE
Spanish
Cambodian
Child Poverty Among Girls Under 16
Child Poverty Among Girls Under 16 Comparison
Spanish
Cambodians
16.9%
CHILD POVERTY AMONG GIRLS UNDER 16
28.6/ 100
METRIC RATING
194th/ 347
METRIC RANK
14.4%
CHILD POVERTY AMONG GIRLS UNDER 16
98.7/ 100
METRIC RATING
61st/ 347
METRIC RANK
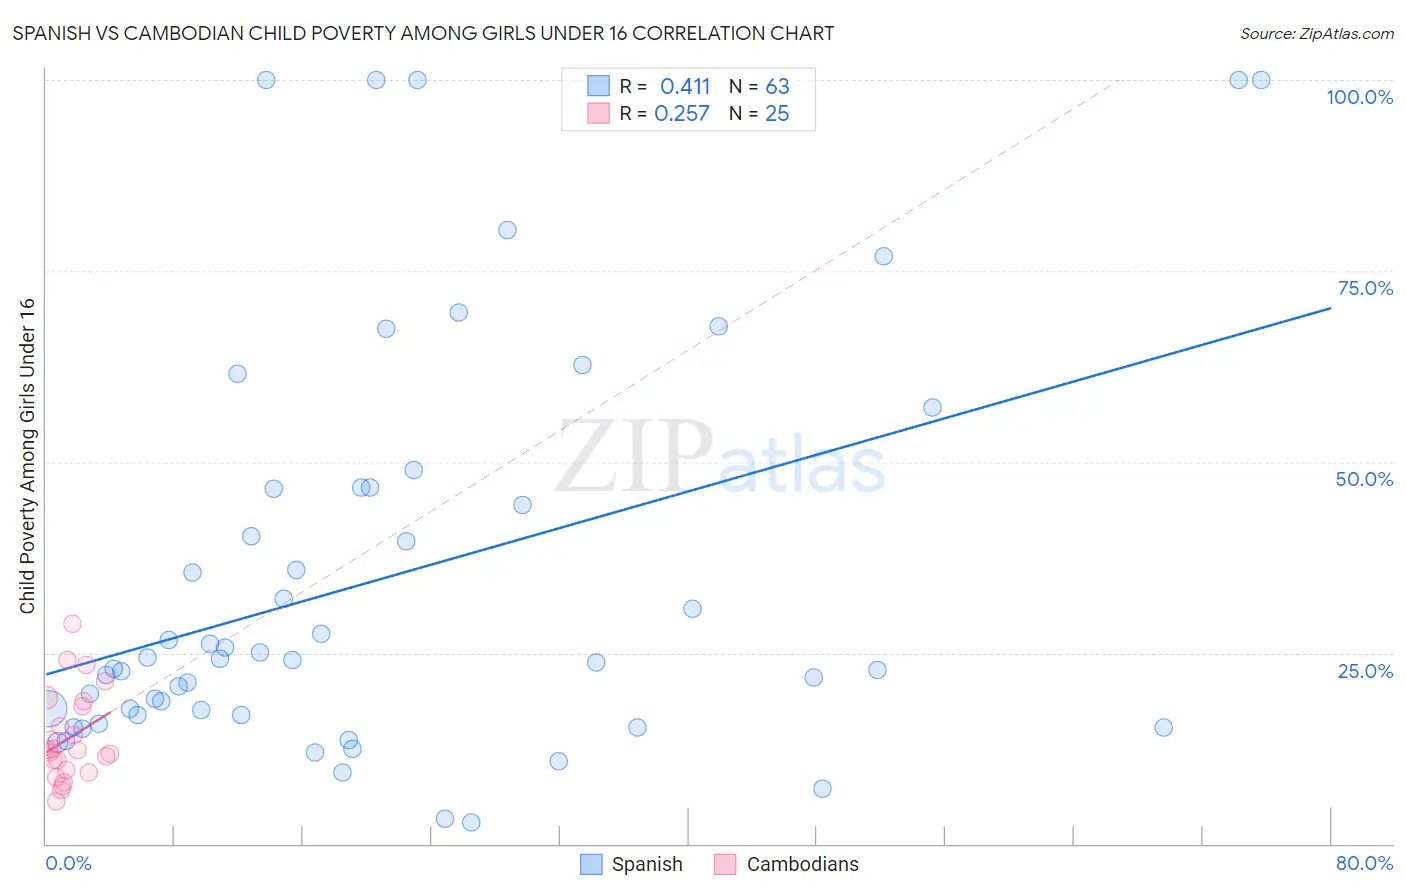
Spanish vs Cambodian Child Poverty Among Girls Under 16 Correlation Chart
The statistical analysis conducted on geographies consisting of 414,340,286 people shows a moderate positive correlation between the proportion of Spanish and poverty level among girls under the age of 16 in the United States with a correlation coefficient (R) of 0.411 and weighted average of 16.9%. Similarly, the statistical analysis conducted on geographies consisting of 102,087,576 people shows a weak positive correlation between the proportion of Cambodians and poverty level among girls under the age of 16 in the United States with a correlation coefficient (R) of 0.257 and weighted average of 14.4%, a difference of 17.3%.
Child Poverty Among Girls Under 16 Correlation Summary
| Measurement | Spanish | Cambodian |
| Minimum | 2.9% | 5.5% |
| Maximum | 100.0% | 28.9% |
| Range | 97.1% | 23.4% |
| Mean | 34.8% | 13.9% |
| Median | 24.1% | 12.2% |
| Interquartile 25% (IQ1) | 16.8% | 9.5% |
| Interquartile 75% (IQ3) | 46.7% | 18.4% |
| Interquartile Range (IQR) | 29.9% | 8.8% |
| Standard Deviation (Sample) | 26.6% | 5.9% |
| Standard Deviation (Population) | 26.4% | 5.8% |
Similar Demographics by Child Poverty Among Girls Under 16
Demographics Similar to Spanish by Child Poverty Among Girls Under 16
In terms of child poverty among girls under 16, the demographic groups most similar to Spanish are Aleut (16.9%, a difference of 0.010%), Immigrants from Uganda (16.8%, a difference of 0.36%), Immigrants from the Azores (16.8%, a difference of 0.37%), Immigrants from Costa Rica (17.0%, a difference of 0.43%), and Celtic (17.0%, a difference of 0.48%).
| Demographics | Rating | Rank | Child Poverty Among Girls Under 16 |
| Immigrants | Morocco | 34.6 /100 | #187 | Fair 16.8% |
| Arabs | 34.5 /100 | #188 | Fair 16.8% |
| Immigrants | Bosnia and Herzegovina | 32.5 /100 | #189 | Fair 16.8% |
| Kenyans | 32.3 /100 | #190 | Fair 16.8% |
| Immigrants | Azores | 31.3 /100 | #191 | Fair 16.8% |
| Immigrants | Uganda | 31.3 /100 | #192 | Fair 16.8% |
| Aleuts | 28.7 /100 | #193 | Fair 16.9% |
| Spanish | 28.6 /100 | #194 | Fair 16.9% |
| Immigrants | Costa Rica | 25.6 /100 | #195 | Fair 17.0% |
| Celtics | 25.2 /100 | #196 | Fair 17.0% |
| Spaniards | 24.9 /100 | #197 | Fair 17.0% |
| Immigrants | Lebanon | 22.6 /100 | #198 | Fair 17.1% |
| Immigrants | Afghanistan | 22.4 /100 | #199 | Fair 17.1% |
| Immigrants | Uzbekistan | 21.5 /100 | #200 | Fair 17.1% |
| Immigrants | Kenya | 17.8 /100 | #201 | Poor 17.2% |
Demographics Similar to Cambodians by Child Poverty Among Girls Under 16
In terms of child poverty among girls under 16, the demographic groups most similar to Cambodians are Polish (14.4%, a difference of 0.0%), Scandinavian (14.4%, a difference of 0.11%), Immigrants from Europe (14.4%, a difference of 0.16%), Zimbabwean (14.4%, a difference of 0.20%), and Immigrants from Bulgaria (14.4%, a difference of 0.26%).
| Demographics | Rating | Rank | Child Poverty Among Girls Under 16 |
| Estonians | 98.9 /100 | #54 | Exceptional 14.3% |
| Immigrants | Romania | 98.9 /100 | #55 | Exceptional 14.3% |
| Immigrants | Indonesia | 98.9 /100 | #56 | Exceptional 14.4% |
| Immigrants | Serbia | 98.9 /100 | #57 | Exceptional 14.4% |
| Immigrants | Bulgaria | 98.8 /100 | #58 | Exceptional 14.4% |
| Zimbabweans | 98.8 /100 | #59 | Exceptional 14.4% |
| Poles | 98.7 /100 | #60 | Exceptional 14.4% |
| Cambodians | 98.7 /100 | #61 | Exceptional 14.4% |
| Scandinavians | 98.7 /100 | #62 | Exceptional 14.4% |
| Immigrants | Europe | 98.7 /100 | #63 | Exceptional 14.4% |
| Immigrants | Philippines | 98.6 /100 | #64 | Exceptional 14.4% |
| Immigrants | Sweden | 98.6 /100 | #65 | Exceptional 14.5% |
| Immigrants | Belgium | 98.5 /100 | #66 | Exceptional 14.5% |
| Laotians | 98.4 /100 | #67 | Exceptional 14.5% |
| Immigrants | Argentina | 98.3 /100 | #68 | Exceptional 14.6% |