Spanish American vs Osage Female Poverty
COMPARE
Spanish American
Osage
Female Poverty
Female Poverty Comparison
Spanish Americans
Osage
16.2%
FEMALE POVERTY
0.0/ 100
METRIC RATING
284th/ 347
METRIC RANK
14.8%
FEMALE POVERTY
1.5/ 100
METRIC RATING
232nd/ 347
METRIC RANK
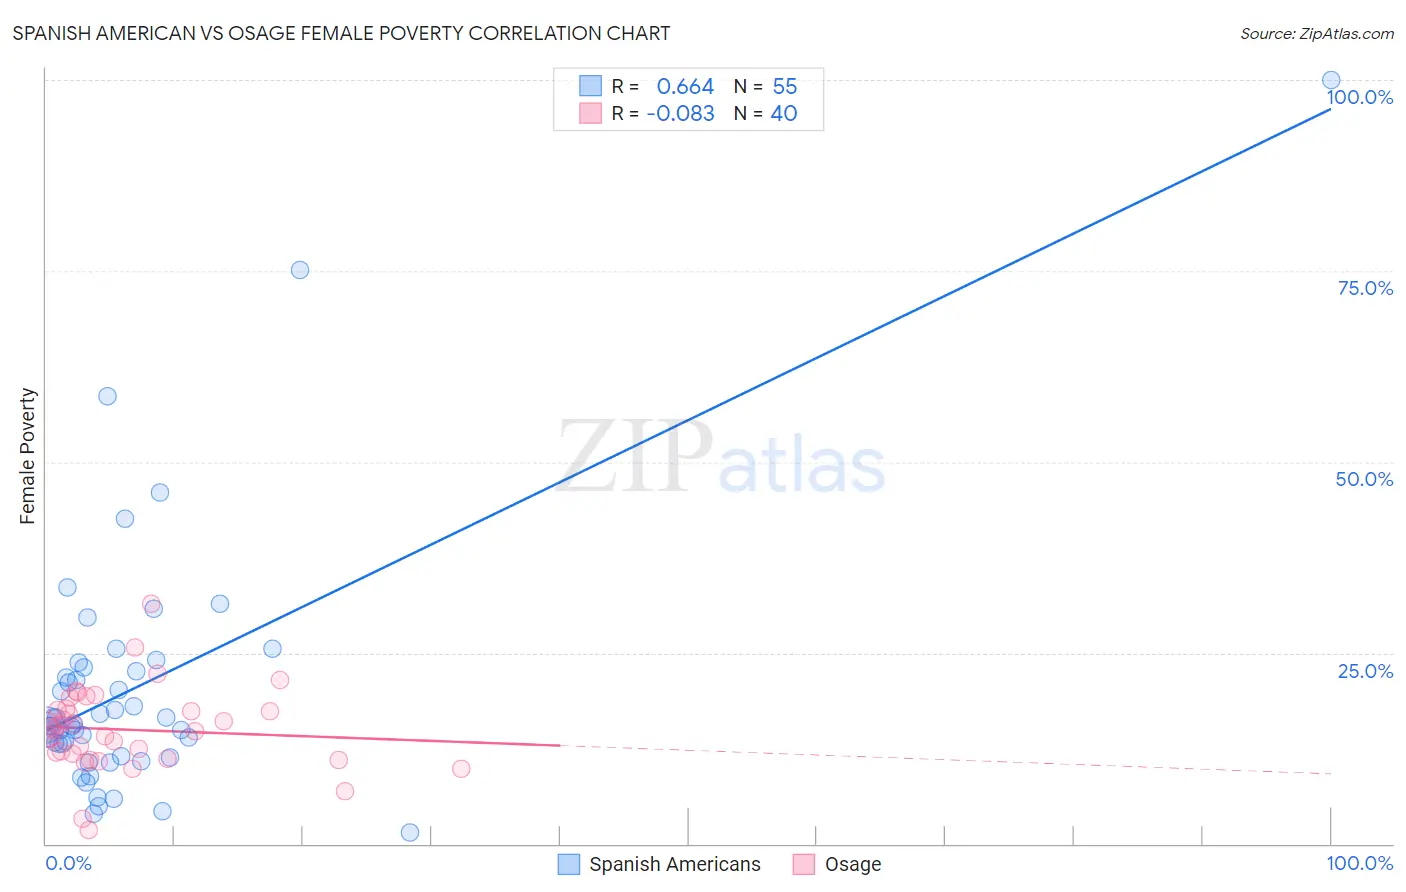
Spanish American vs Osage Female Poverty Correlation Chart
The statistical analysis conducted on geographies consisting of 103,161,919 people shows a significant positive correlation between the proportion of Spanish Americans and poverty level among females in the United States with a correlation coefficient (R) of 0.664 and weighted average of 16.2%. Similarly, the statistical analysis conducted on geographies consisting of 91,795,919 people shows a slight negative correlation between the proportion of Osage and poverty level among females in the United States with a correlation coefficient (R) of -0.083 and weighted average of 14.8%, a difference of 9.2%.
Female Poverty Correlation Summary
| Measurement | Spanish American | Osage |
| Minimum | 1.4% | 1.8% |
| Maximum | 100.0% | 31.5% |
| Range | 98.6% | 29.7% |
| Mean | 20.4% | 14.9% |
| Median | 15.6% | 14.9% |
| Interquartile 25% (IQ1) | 11.5% | 11.4% |
| Interquartile 75% (IQ3) | 23.0% | 17.6% |
| Interquartile Range (IQR) | 11.5% | 6.2% |
| Standard Deviation (Sample) | 17.0% | 5.5% |
| Standard Deviation (Population) | 16.8% | 5.4% |
Similar Demographics by Female Poverty
Demographics Similar to Spanish Americans by Female Poverty
In terms of female poverty, the demographic groups most similar to Spanish Americans are Immigrants from Cuba (16.1%, a difference of 0.050%), Comanche (16.2%, a difference of 0.080%), Immigrants from Haiti (16.1%, a difference of 0.13%), West Indian (16.1%, a difference of 0.29%), and Vietnamese (16.1%, a difference of 0.31%).
| Demographics | Rating | Rank | Female Poverty |
| Bangladeshis | 0.0 /100 | #277 | Tragic 16.0% |
| Immigrants | West Indies | 0.0 /100 | #278 | Tragic 16.1% |
| Immigrants | Bahamas | 0.0 /100 | #279 | Tragic 16.1% |
| Vietnamese | 0.0 /100 | #280 | Tragic 16.1% |
| West Indians | 0.0 /100 | #281 | Tragic 16.1% |
| Immigrants | Haiti | 0.0 /100 | #282 | Tragic 16.1% |
| Immigrants | Cuba | 0.0 /100 | #283 | Tragic 16.1% |
| Spanish Americans | 0.0 /100 | #284 | Tragic 16.2% |
| Comanche | 0.0 /100 | #285 | Tragic 16.2% |
| Inupiat | 0.0 /100 | #286 | Tragic 16.2% |
| Immigrants | Belize | 0.0 /100 | #287 | Tragic 16.3% |
| Indonesians | 0.0 /100 | #288 | Tragic 16.4% |
| Blackfeet | 0.0 /100 | #289 | Tragic 16.4% |
| Immigrants | Bangladesh | 0.0 /100 | #290 | Tragic 16.4% |
| Yaqui | 0.0 /100 | #291 | Tragic 16.4% |
Demographics Similar to Osage by Female Poverty
In terms of female poverty, the demographic groups most similar to Osage are Immigrants from Saudi Arabia (14.8%, a difference of 0.10%), Nigerian (14.8%, a difference of 0.31%), Alaska Native (14.7%, a difference of 0.41%), Ghanaian (14.7%, a difference of 0.61%), and Fijian (14.9%, a difference of 0.62%).
| Demographics | Rating | Rank | Female Poverty |
| Immigrants | Micronesia | 2.8 /100 | #225 | Tragic 14.6% |
| Immigrants | Eritrea | 2.4 /100 | #226 | Tragic 14.6% |
| Immigrants | Nigeria | 2.1 /100 | #227 | Tragic 14.7% |
| German Russians | 2.0 /100 | #228 | Tragic 14.7% |
| Ghanaians | 1.9 /100 | #229 | Tragic 14.7% |
| Alaska Natives | 1.8 /100 | #230 | Tragic 14.7% |
| Nigerians | 1.7 /100 | #231 | Tragic 14.8% |
| Osage | 1.5 /100 | #232 | Tragic 14.8% |
| Immigrants | Saudi Arabia | 1.4 /100 | #233 | Tragic 14.8% |
| Fijians | 1.1 /100 | #234 | Tragic 14.9% |
| Immigrants | Laos | 0.9 /100 | #235 | Tragic 15.0% |
| Cree | 0.7 /100 | #236 | Tragic 15.1% |
| French American Indians | 0.6 /100 | #237 | Tragic 15.1% |
| Immigrants | Armenia | 0.6 /100 | #238 | Tragic 15.1% |
| Immigrants | Middle Africa | 0.5 /100 | #239 | Tragic 15.2% |