Spanish American vs Immigrants from Northern Africa Child Poverty Among Girls Under 16
COMPARE
Spanish American
Immigrants from Northern Africa
Child Poverty Among Girls Under 16
Child Poverty Among Girls Under 16 Comparison
Spanish Americans
Immigrants from Northern Africa
19.8%
CHILD POVERTY AMONG GIRLS UNDER 16
0.1/ 100
METRIC RATING
266th/ 347
METRIC RANK
16.0%
CHILD POVERTY AMONG GIRLS UNDER 16
72.0/ 100
METRIC RATING
161st/ 347
METRIC RANK
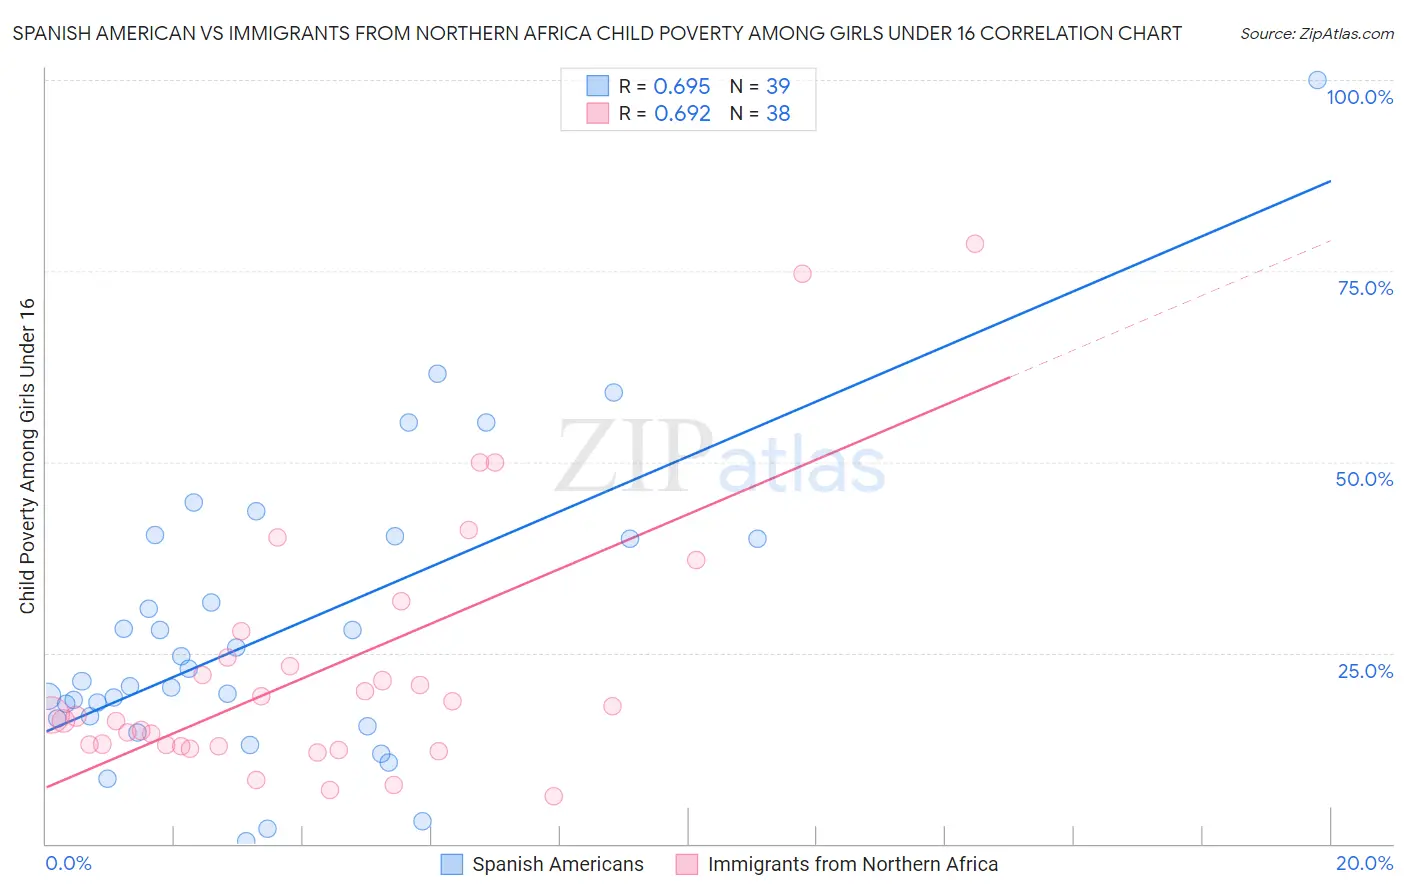
Spanish American vs Immigrants from Northern Africa Child Poverty Among Girls Under 16 Correlation Chart
The statistical analysis conducted on geographies consisting of 102,807,072 people shows a significant positive correlation between the proportion of Spanish Americans and poverty level among girls under the age of 16 in the United States with a correlation coefficient (R) of 0.695 and weighted average of 19.8%. Similarly, the statistical analysis conducted on geographies consisting of 316,657,809 people shows a significant positive correlation between the proportion of Immigrants from Northern Africa and poverty level among girls under the age of 16 in the United States with a correlation coefficient (R) of 0.692 and weighted average of 16.0%, a difference of 23.6%.
Child Poverty Among Girls Under 16 Correlation Summary
| Measurement | Spanish American | Immigrants from Northern Africa |
| Minimum | 0.37% | 6.2% |
| Maximum | 100.0% | 78.6% |
| Range | 99.6% | 72.3% |
| Mean | 27.9% | 22.9% |
| Median | 21.3% | 16.8% |
| Interquartile 25% (IQ1) | 16.4% | 12.8% |
| Interquartile 75% (IQ3) | 40.0% | 24.4% |
| Interquartile Range (IQR) | 23.6% | 11.6% |
| Standard Deviation (Sample) | 19.5% | 16.9% |
| Standard Deviation (Population) | 19.2% | 16.7% |
Similar Demographics by Child Poverty Among Girls Under 16
Demographics Similar to Spanish Americans by Child Poverty Among Girls Under 16
In terms of child poverty among girls under 16, the demographic groups most similar to Spanish Americans are Immigrants from Bangladesh (19.9%, a difference of 0.22%), Immigrants from Jamaica (19.8%, a difference of 0.25%), Spanish American Indian (19.9%, a difference of 0.26%), Liberian (19.9%, a difference of 0.35%), and Cherokee (19.9%, a difference of 0.54%).
| Demographics | Rating | Rank | Child Poverty Among Girls Under 16 |
| Ottawa | 0.2 /100 | #259 | Tragic 19.4% |
| Mexican American Indians | 0.2 /100 | #260 | Tragic 19.5% |
| Vietnamese | 0.2 /100 | #261 | Tragic 19.5% |
| Chickasaw | 0.1 /100 | #262 | Tragic 19.6% |
| Immigrants | Burma/Myanmar | 0.1 /100 | #263 | Tragic 19.7% |
| Jamaicans | 0.1 /100 | #264 | Tragic 19.7% |
| Immigrants | Jamaica | 0.1 /100 | #265 | Tragic 19.8% |
| Spanish Americans | 0.1 /100 | #266 | Tragic 19.8% |
| Immigrants | Bangladesh | 0.1 /100 | #267 | Tragic 19.9% |
| Spanish American Indians | 0.1 /100 | #268 | Tragic 19.9% |
| Liberians | 0.1 /100 | #269 | Tragic 19.9% |
| Cherokee | 0.1 /100 | #270 | Tragic 19.9% |
| Immigrants | Barbados | 0.1 /100 | #271 | Tragic 19.9% |
| Immigrants | El Salvador | 0.1 /100 | #272 | Tragic 20.0% |
| Bangladeshis | 0.1 /100 | #273 | Tragic 20.0% |
Demographics Similar to Immigrants from Northern Africa by Child Poverty Among Girls Under 16
In terms of child poverty among girls under 16, the demographic groups most similar to Immigrants from Northern Africa are French (16.0%, a difference of 0.11%), French Canadian (16.1%, a difference of 0.47%), Slovak (15.9%, a difference of 0.49%), Guamanian/Chamorro (15.9%, a difference of 0.50%), and Immigrants from Oceania (16.1%, a difference of 0.52%).
| Demographics | Rating | Rank | Child Poverty Among Girls Under 16 |
| Immigrants | Chile | 76.7 /100 | #154 | Good 15.9% |
| Syrians | 76.7 /100 | #155 | Good 15.9% |
| Immigrants | Fiji | 76.1 /100 | #156 | Good 15.9% |
| Colombians | 76.1 /100 | #157 | Good 15.9% |
| Guamanians/Chamorros | 75.3 /100 | #158 | Good 15.9% |
| Slovaks | 75.2 /100 | #159 | Good 15.9% |
| French | 72.8 /100 | #160 | Good 16.0% |
| Immigrants | Northern Africa | 72.0 /100 | #161 | Good 16.0% |
| French Canadians | 68.7 /100 | #162 | Good 16.1% |
| Immigrants | Oceania | 68.4 /100 | #163 | Good 16.1% |
| Immigrants | Colombia | 67.8 /100 | #164 | Good 16.1% |
| Immigrants | Germany | 67.3 /100 | #165 | Good 16.1% |
| South Americans | 67.2 /100 | #166 | Good 16.1% |
| Uruguayans | 64.7 /100 | #167 | Good 16.2% |
| Yugoslavians | 64.4 /100 | #168 | Good 16.2% |