South American Indian vs Immigrants from Uganda Single Female Poverty
COMPARE
South American Indian
Immigrants from Uganda
Single Female Poverty
Single Female Poverty Comparison
South American Indians
Immigrants from Uganda
20.6%
SINGLE FEMALE POVERTY
75.7/ 100
METRIC RATING
156th/ 347
METRIC RANK
20.3%
SINGLE FEMALE POVERTY
89.1/ 100
METRIC RATING
142nd/ 347
METRIC RANK
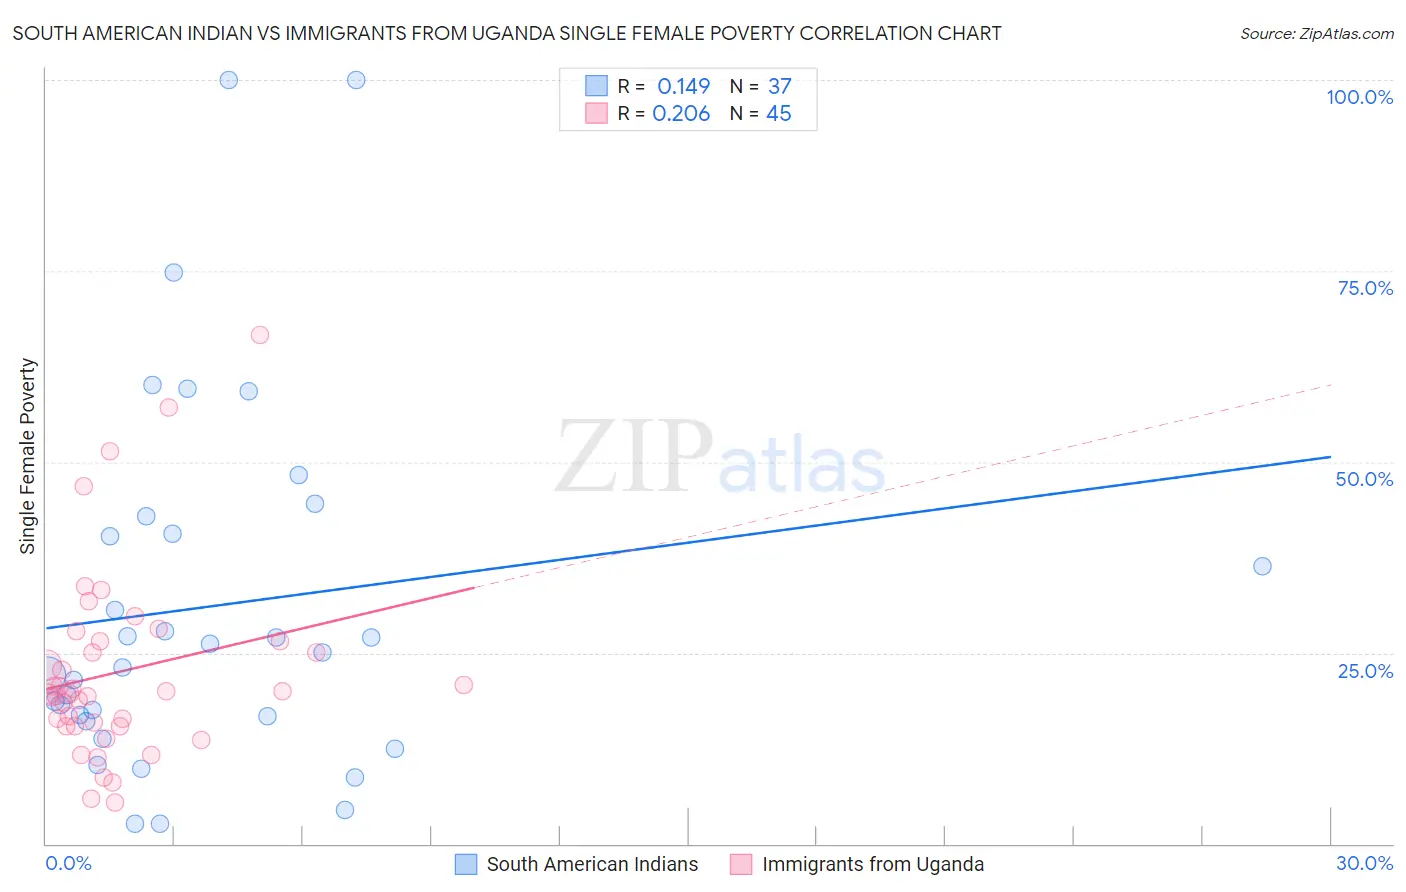
South American Indian vs Immigrants from Uganda Single Female Poverty Correlation Chart
The statistical analysis conducted on geographies consisting of 163,615,516 people shows a poor positive correlation between the proportion of South American Indians and poverty level among single females in the United States with a correlation coefficient (R) of 0.149 and weighted average of 20.6%. Similarly, the statistical analysis conducted on geographies consisting of 125,509,533 people shows a weak positive correlation between the proportion of Immigrants from Uganda and poverty level among single females in the United States with a correlation coefficient (R) of 0.206 and weighted average of 20.3%, a difference of 1.6%.
Single Female Poverty Correlation Summary
| Measurement | South American Indian | Immigrants from Uganda |
| Minimum | 2.6% | 5.5% |
| Maximum | 100.0% | 66.7% |
| Range | 97.4% | 61.2% |
| Mean | 31.1% | 22.5% |
| Median | 25.0% | 19.7% |
| Interquartile 25% (IQ1) | 16.4% | 15.4% |
| Interquartile 75% (IQ3) | 41.7% | 26.5% |
| Interquartile Range (IQR) | 25.3% | 11.1% |
| Standard Deviation (Sample) | 24.0% | 12.6% |
| Standard Deviation (Population) | 23.6% | 12.4% |
Demographics Similar to South American Indians and Immigrants from Uganda by Single Female Poverty
In terms of single female poverty, the demographic groups most similar to South American Indians are Samoan (20.6%, a difference of 0.030%), Immigrants from Western Europe (20.6%, a difference of 0.10%), Immigrants from Oceania (20.7%, a difference of 0.12%), Swedish (20.6%, a difference of 0.13%), and Immigrants from Uruguay (20.6%, a difference of 0.18%). Similarly, the demographic groups most similar to Immigrants from Uganda are Immigrants from North America (20.3%, a difference of 0.080%), Australian (20.3%, a difference of 0.12%), Immigrants from Uzbekistan (20.3%, a difference of 0.13%), Immigrants from Kuwait (20.3%, a difference of 0.23%), and Syrian (20.3%, a difference of 0.23%).
| Demographics | Rating | Rank | Single Female Poverty |
| Immigrants | Kuwait | 90.4 /100 | #139 | Exceptional 20.3% |
| Syrians | 90.4 /100 | #140 | Exceptional 20.3% |
| Immigrants | North America | 89.5 /100 | #141 | Excellent 20.3% |
| Immigrants | Uganda | 89.1 /100 | #142 | Excellent 20.3% |
| Australians | 88.4 /100 | #143 | Excellent 20.3% |
| Immigrants | Uzbekistan | 88.3 /100 | #144 | Excellent 20.3% |
| Austrians | 85.8 /100 | #145 | Excellent 20.4% |
| Venezuelans | 85.5 /100 | #146 | Excellent 20.4% |
| South Africans | 85.3 /100 | #147 | Excellent 20.4% |
| Luxembourgers | 84.9 /100 | #148 | Excellent 20.4% |
| Portuguese | 81.5 /100 | #149 | Excellent 20.5% |
| Immigrants | Denmark | 80.5 /100 | #150 | Excellent 20.5% |
| Puget Sound Salish | 79.6 /100 | #151 | Good 20.6% |
| Immigrants | Uruguay | 77.7 /100 | #152 | Good 20.6% |
| Swedes | 77.1 /100 | #153 | Good 20.6% |
| Immigrants | Western Europe | 76.7 /100 | #154 | Good 20.6% |
| Samoans | 76.0 /100 | #155 | Good 20.6% |
| South American Indians | 75.7 /100 | #156 | Good 20.6% |
| Immigrants | Oceania | 74.3 /100 | #157 | Good 20.7% |
| Danes | 73.0 /100 | #158 | Good 20.7% |
| Costa Ricans | 71.8 /100 | #159 | Good 20.7% |