South American Indian vs Immigrants from Syria Receiving Food Stamps
COMPARE
South American Indian
Immigrants from Syria
Receiving Food Stamps
Receiving Food Stamps Comparison
South American Indians
Immigrants from Syria
11.9%
RECEIVING FOOD STAMPS
41.7/ 100
METRIC RATING
181st/ 347
METRIC RANK
11.7%
RECEIVING FOOD STAMPS
53.4/ 100
METRIC RATING
173rd/ 347
METRIC RANK
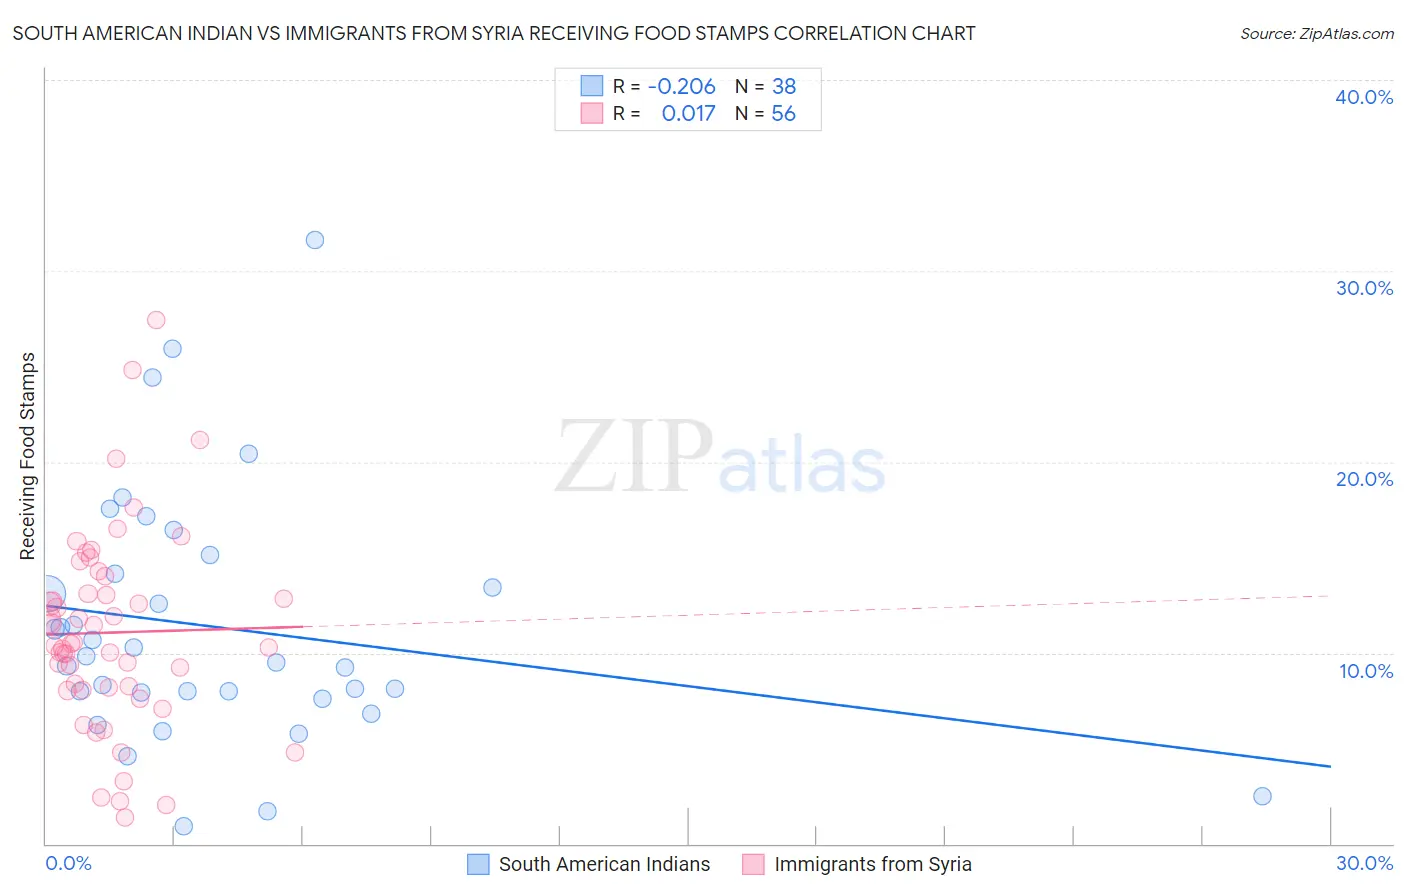
South American Indian vs Immigrants from Syria Receiving Food Stamps Correlation Chart
The statistical analysis conducted on geographies consisting of 164,403,103 people shows a weak negative correlation between the proportion of South American Indians and percentage of population receiving government assistance and/or food stamps in the United States with a correlation coefficient (R) of -0.206 and weighted average of 11.9%. Similarly, the statistical analysis conducted on geographies consisting of 173,879,685 people shows no correlation between the proportion of Immigrants from Syria and percentage of population receiving government assistance and/or food stamps in the United States with a correlation coefficient (R) of 0.017 and weighted average of 11.7%, a difference of 1.7%.
Receiving Food Stamps Correlation Summary
| Measurement | South American Indian | Immigrants from Syria |
| Minimum | 0.90% | 1.4% |
| Maximum | 31.6% | 27.4% |
| Range | 30.7% | 26.0% |
| Mean | 11.3% | 11.1% |
| Median | 9.7% | 10.4% |
| Interquartile 25% (IQ1) | 7.9% | 8.1% |
| Interquartile 75% (IQ3) | 14.1% | 13.5% |
| Interquartile Range (IQR) | 6.2% | 5.5% |
| Standard Deviation (Sample) | 6.6% | 5.2% |
| Standard Deviation (Population) | 6.5% | 5.2% |
Demographics Similar to South American Indians and Immigrants from Syria by Receiving Food Stamps
In terms of receiving food stamps, the demographic groups most similar to South American Indians are Immigrants from Morocco (11.9%, a difference of 0.15%), Immigrants from Uganda (11.9%, a difference of 0.20%), Spaniard (11.9%, a difference of 0.28%), Uruguayan (11.8%, a difference of 0.44%), and Immigrants from Kenya (11.8%, a difference of 0.66%). Similarly, the demographic groups most similar to Immigrants from Syria are Guamanian/Chamorro (11.7%, a difference of 0.11%), Immigrants from Western Asia (11.6%, a difference of 0.42%), Immigrants from Eritrea (11.7%, a difference of 0.48%), Osage (11.7%, a difference of 0.51%), and Peruvian (11.7%, a difference of 0.58%).
| Demographics | Rating | Rank | Receiving Food Stamps |
| Kenyans | 60.2 /100 | #167 | Good 11.6% |
| Tlingit-Haida | 59.1 /100 | #168 | Average 11.6% |
| Immigrants | Eastern Africa | 58.3 /100 | #169 | Average 11.6% |
| Costa Ricans | 57.9 /100 | #170 | Average 11.6% |
| Immigrants | Western Asia | 56.4 /100 | #171 | Average 11.6% |
| Guamanians/Chamorros | 54.2 /100 | #172 | Average 11.7% |
| Immigrants | Syria | 53.4 /100 | #173 | Average 11.7% |
| Immigrants | Eritrea | 50.0 /100 | #174 | Average 11.7% |
| Osage | 49.8 /100 | #175 | Average 11.7% |
| Peruvians | 49.3 /100 | #176 | Average 11.7% |
| Immigrants | Ukraine | 48.4 /100 | #177 | Average 11.8% |
| German Russians | 48.1 /100 | #178 | Average 11.8% |
| Immigrants | Kenya | 46.4 /100 | #179 | Average 11.8% |
| Uruguayans | 44.8 /100 | #180 | Average 11.8% |
| South American Indians | 41.7 /100 | #181 | Average 11.9% |
| Immigrants | Morocco | 40.7 /100 | #182 | Average 11.9% |
| Immigrants | Uganda | 40.3 /100 | #183 | Average 11.9% |
| Spaniards | 39.8 /100 | #184 | Fair 11.9% |
| Immigrants | Iraq | 37.1 /100 | #185 | Fair 12.0% |
| Spanish | 36.9 /100 | #186 | Fair 12.0% |
| Albanians | 35.4 /100 | #187 | Fair 12.0% |