South American Indian vs Immigrants from Syria 6th Grade
COMPARE
South American Indian
Immigrants from Syria
6th Grade
6th Grade Comparison
South American Indians
Immigrants from Syria
96.7%
6TH GRADE
3.5/ 100
METRIC RATING
232nd/ 347
METRIC RANK
96.7%
6TH GRADE
5.9/ 100
METRIC RATING
222nd/ 347
METRIC RANK
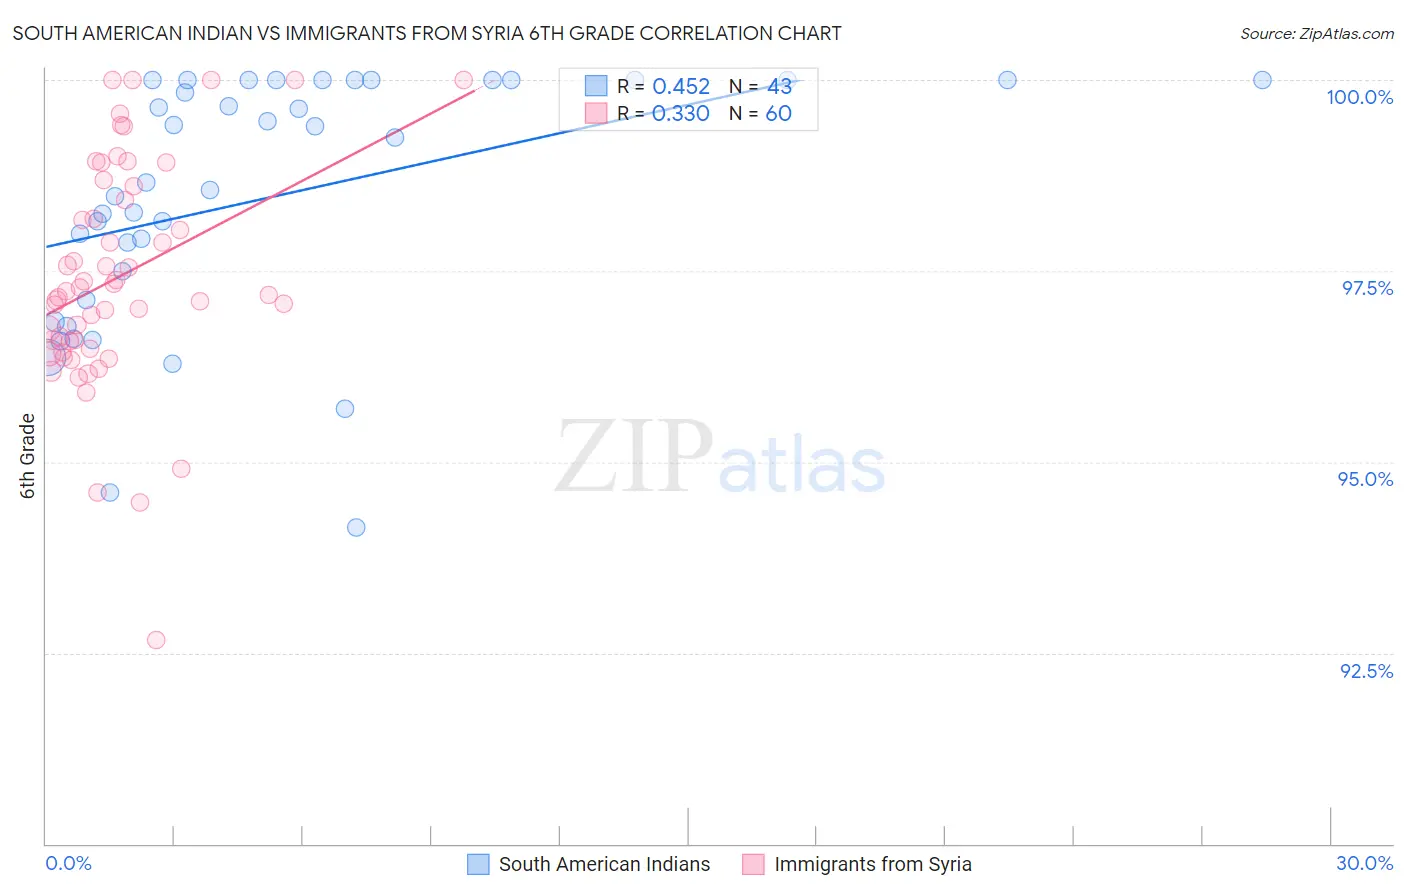
South American Indian vs Immigrants from Syria 6th Grade Correlation Chart
The statistical analysis conducted on geographies consisting of 164,573,401 people shows a moderate positive correlation between the proportion of South American Indians and percentage of population with at least 6th grade education in the United States with a correlation coefficient (R) of 0.452 and weighted average of 96.7%. Similarly, the statistical analysis conducted on geographies consisting of 174,108,374 people shows a mild positive correlation between the proportion of Immigrants from Syria and percentage of population with at least 6th grade education in the United States with a correlation coefficient (R) of 0.330 and weighted average of 96.7%, a difference of 0.060%.
6th Grade Correlation Summary
| Measurement | South American Indian | Immigrants from Syria |
| Minimum | 94.1% | 92.7% |
| Maximum | 100.0% | 100.0% |
| Range | 5.9% | 7.3% |
| Mean | 98.5% | 97.4% |
| Median | 98.7% | 97.2% |
| Interquartile 25% (IQ1) | 97.1% | 96.5% |
| Interquartile 75% (IQ3) | 100.0% | 98.5% |
| Interquartile Range (IQR) | 2.9% | 2.0% |
| Standard Deviation (Sample) | 1.6% | 1.5% |
| Standard Deviation (Population) | 1.6% | 1.5% |
Demographics Similar to South American Indians and Immigrants from Syria by 6th Grade
In terms of 6th grade, the demographic groups most similar to South American Indians are Subsaharan African (96.7%, a difference of 0.0%), Yuman (96.7%, a difference of 0.010%), Immigrants from Panama (96.7%, a difference of 0.020%), Immigrants from Western Asia (96.7%, a difference of 0.020%), and Immigrants from Malaysia (96.7%, a difference of 0.020%). Similarly, the demographic groups most similar to Immigrants from Syria are Tongan (96.7%, a difference of 0.0%), Immigrants from Morocco (96.7%, a difference of 0.010%), Costa Rican (96.8%, a difference of 0.020%), Liberian (96.8%, a difference of 0.030%), and Navajo (96.8%, a difference of 0.030%).
| Demographics | Rating | Rank | 6th Grade |
| Liberians | 7.5 /100 | #217 | Tragic 96.8% |
| Navajo | 7.3 /100 | #218 | Tragic 96.8% |
| Costa Ricans | 6.8 /100 | #219 | Tragic 96.8% |
| Immigrants | Morocco | 6.2 /100 | #220 | Tragic 96.7% |
| Tongans | 6.1 /100 | #221 | Tragic 96.7% |
| Immigrants | Syria | 5.9 /100 | #222 | Tragic 96.7% |
| Bahamians | 4.8 /100 | #223 | Tragic 96.7% |
| Immigrants | Southern Europe | 4.4 /100 | #224 | Tragic 96.7% |
| Immigrants | Pakistan | 4.4 /100 | #225 | Tragic 96.7% |
| Immigrants | Panama | 4.2 /100 | #226 | Tragic 96.7% |
| Immigrants | Western Asia | 4.1 /100 | #227 | Tragic 96.7% |
| Immigrants | Malaysia | 4.0 /100 | #228 | Tragic 96.7% |
| Assyrians/Chaldeans/Syriacs | 4.0 /100 | #229 | Tragic 96.7% |
| Immigrants | Eastern Asia | 4.0 /100 | #230 | Tragic 96.7% |
| Sub-Saharan Africans | 3.5 /100 | #231 | Tragic 96.7% |
| South American Indians | 3.5 /100 | #232 | Tragic 96.7% |
| Yuman | 3.2 /100 | #233 | Tragic 96.7% |
| Uruguayans | 2.5 /100 | #234 | Tragic 96.6% |
| Asians | 2.4 /100 | #235 | Tragic 96.6% |
| Immigrants | Indonesia | 2.3 /100 | #236 | Tragic 96.6% |
| Immigrants | Eastern Africa | 2.0 /100 | #237 | Tragic 96.6% |