South American Indian vs Jamaican Receiving Food Stamps

COMPARE

South American Indian
Race
Ancestry
AfghanAfricanAlaska NativeAlaskan AthabascanAlbanianAleutAlsatianAmericanApacheArabArapahoArgentineanArmenianAssyrian/Chaldean/SyriacAustralianAustrianBahamianBangladeshiBarbadianBasqueBelgianBelizeanBermudanBhutaneseBlackfeetBolivianBrazilianBritishBritish West IndianBulgarianBurmeseCajunCambodianCanadianCape VerdeanCarpatho RusynCelticCentral AmericanCentral American IndianCherokeeCheyenneChickasawChileanChineseChippewaChoctawColombianColvilleComancheCosta RicanCreeCreekCroatianCrowCubanCypriotCzechCzechoslovakianDanishDelawareDominicanDutchDutch West IndianEastern EuropeanEcuadorianEgyptianEnglishEstonianEthiopianEuropeanFijianFilipinoFinnishFrenchFrench American IndianFrench CanadianGermanGerman RussianGhanaianGreekGuamanian/ChamorroGuatemalanGuyaneseHaitianHmongHonduranHopiHoumaHungarianIcelanderIndian (Asian)IndonesianInupiatIranianIraqiIrishIroquoisIsraeliItalianJapaneseJordanianKenyanKiowaKoreanLaotianLatvianLebaneseLiberianLithuanianLumbeeLuxembourgerMacedonianMalaysianMalteseMarshalleseMenomineeMexicanMexican American IndianMongolianMoroccanNative HawaiianNavajoNepaleseNew ZealanderNicaraguanNigerianNorthern EuropeanNorwegianOkinawanOsageOttawaPaiutePakistaniPalestinianPanamanianParaguayanPennsylvania GermanPeruvianPimaPolishPortuguesePotawatomiPuebloPuerto RicanPuget Sound SalishRomanianRussianSalvadoranSamoanScandinavianScotch-IrishScottishSeminoleSenegaleseSerbianShoshoneSierra LeoneanSiouxSlavicSlovakSloveneSomaliSouth AfricanSouth AmericanSouth American IndianSoviet UnionSpaniardSpanishSpanish AmericanSpanish American IndianSri LankanSubsaharan AfricanSudaneseSwedishSwissSyrianTaiwaneseThaiTlingit-HaidaTohono O'OdhamTonganTrinidadian and TobagonianTsimshianTurkishU.S. Virgin IslanderUgandanUkrainianUruguayanUteVenezuelanVietnameseWelshWest IndianYakamaYaquiYugoslavianYumanYup'ikZimbabwean
Immigration
NonimmigrantsImmigrantsAfghanistanAfricaAlbaniaArgentinaArmeniaAsiaAustraliaAustriaBahamasBangladeshBarbadosBelarusBelgiumBelizeBoliviaBosnia and HerzegovinaBrazilBulgariaBurma/MyanmarCabo VerdeCambodiaCameroonCanadaCaribbeanCentral AmericaChileChinaColombiaCongoCosta RicaCroatiaCubaCzechoslovakiaDenmarkDominicaDominican RepublicEastern AfricaEastern AsiaEastern EuropeEcuadorEgyptEl SalvadorEnglandEritreaEthiopiaEuropeFijiFranceGermanyGhanaGreeceGrenadaGuatemalaGuyanaHaitiHondurasHong KongHungaryIndiaIndonesiaIranIraqIrelandIsraelItalyJamaicaJapanJordanKazakhstanKenyaKoreaKuwaitLaosLatin AmericaLatviaLebanonLiberiaLithuaniaMalaysiaMexicoMicronesiaMiddle AfricaMoldovaMoroccoNepalNetherlandsNicaraguaNigeriaNorth AmericaNorth MacedoniaNorthern AfricaNorthern EuropeNorwayOceaniaPakistanPanamaPeruPhilippinesPolandPortugalRomaniaRussiaSaudi ArabiaScotlandSenegalSerbiaSierra LeoneSingaporeSomaliaSouth AfricaSouth AmericaSouth Central AsiaSouth Eastern AsiaSouthern EuropeSpainSri LankaSt. Vincent and the GrenadinesSudanSwedenSwitzerlandSyriaTaiwanThailandTrinidad and TobagoTurkeyUgandaUkraineUruguayUzbekistanVenezuelaVietnamWest IndiesWestern AfricaWestern AsiaWestern EuropeYemenZaireZimbabweAzores
Jamaican
Race
Ancestry
AfghanAfricanAlaska NativeAlaskan AthabascanAlbanianAleutAlsatianAmericanApacheArabArapahoArgentineanArmenianAssyrian/Chaldean/SyriacAustralianAustrianBahamianBangladeshiBarbadianBasqueBelgianBelizeanBermudanBhutaneseBlackfeetBolivianBrazilianBritishBritish West IndianBulgarianBurmeseCajunCambodianCanadianCape VerdeanCarpatho RusynCelticCentral AmericanCentral American IndianCherokeeCheyenneChickasawChileanChineseChippewaChoctawColombianColvilleComancheCosta RicanCreeCreekCroatianCrowCubanCypriotCzechCzechoslovakianDanishDelawareDominicanDutchDutch West IndianEastern EuropeanEcuadorianEgyptianEnglishEstonianEthiopianEuropeanFijianFilipinoFinnishFrenchFrench American IndianFrench CanadianGermanGerman RussianGhanaianGreekGuamanian/ChamorroGuatemalanGuyaneseHaitianHmongHonduranHopiHoumaHungarianIcelanderIndian (Asian)IndonesianInupiatIranianIraqiIrishIroquoisIsraeliItalianJamaicanJapaneseJordanianKenyanKiowaKoreanLaotianLatvianLebaneseLiberianLithuanianLumbeeLuxembourgerMacedonianMalaysianMalteseMarshalleseMenomineeMexicanMexican American IndianMongolianMoroccanNative HawaiianNavajoNepaleseNew ZealanderNicaraguanNigerianNorthern EuropeanNorwegianOkinawanOsageOttawaPaiutePakistaniPalestinianPanamanianParaguayanPennsylvania GermanPeruvianPimaPolishPortuguesePotawatomiPuebloPuerto RicanPuget Sound SalishRomanianRussianSalvadoranSamoanScandinavianScotch-IrishScottishSeminoleSenegaleseSerbianShoshoneSierra LeoneanSiouxSlavicSlovakSloveneSomaliSouth AfricanSouth AmericanSoviet UnionSpaniardSpanishSpanish AmericanSpanish American IndianSri LankanSubsaharan AfricanSudaneseSwedishSwissSyrianTaiwaneseThaiTlingit-HaidaTohono O'OdhamTonganTrinidadian and TobagonianTsimshianTurkishU.S. Virgin IslanderUgandanUkrainianUruguayanUteVenezuelanVietnameseWelshWest IndianYakamaYaquiYugoslavianYumanYup'ikZimbabwean
Immigration
NonimmigrantsImmigrantsAfghanistanAfricaAlbaniaArgentinaArmeniaAsiaAustraliaAustriaBahamasBangladeshBarbadosBelarusBelgiumBelizeBoliviaBosnia and HerzegovinaBrazilBulgariaBurma/MyanmarCabo VerdeCambodiaCameroonCanadaCaribbeanCentral AmericaChileChinaColombiaCongoCosta RicaCroatiaCubaCzechoslovakiaDenmarkDominicaDominican RepublicEastern AfricaEastern AsiaEastern EuropeEcuadorEgyptEl SalvadorEnglandEritreaEthiopiaEuropeFijiFranceGermanyGhanaGreeceGrenadaGuatemalaGuyanaHaitiHondurasHong KongHungaryIndiaIndonesiaIranIraqIrelandIsraelItalyJamaicaJapanJordanKazakhstanKenyaKoreaKuwaitLaosLatin AmericaLatviaLebanonLiberiaLithuaniaMalaysiaMexicoMicronesiaMiddle AfricaMoldovaMoroccoNepalNetherlandsNicaraguaNigeriaNorth AmericaNorth MacedoniaNorthern AfricaNorthern EuropeNorwayOceaniaPakistanPanamaPeruPhilippinesPolandPortugalRomaniaRussiaSaudi ArabiaScotlandSenegalSerbiaSierra LeoneSingaporeSomaliaSouth AfricaSouth AmericaSouth Central AsiaSouth Eastern AsiaSouthern EuropeSpainSri LankaSt. Vincent and the GrenadinesSudanSwedenSwitzerlandSyriaTaiwanThailandTrinidad and TobagoTurkeyUgandaUkraineUruguayUzbekistanVenezuelaVietnamWest IndiesWestern AfricaWestern AsiaWestern EuropeYemenZaireZimbabweAzores
Receiving Food Stamps
Income
Poverty
Unemployment
Labor Participation
Family Structure
Vehicle Availability
Education Level
Disability

Receiving Food Stamps Comparison

South American Indians

Jamaicans

Average
Tragic
11.9%
RECEIVING FOOD STAMPS
41.7/ 100
METRIC RATING
181st/ 347
METRIC RANK
16.4%
RECEIVING FOOD STAMPS
0.0/ 100
METRIC RATING
306th/ 347
METRIC RANK

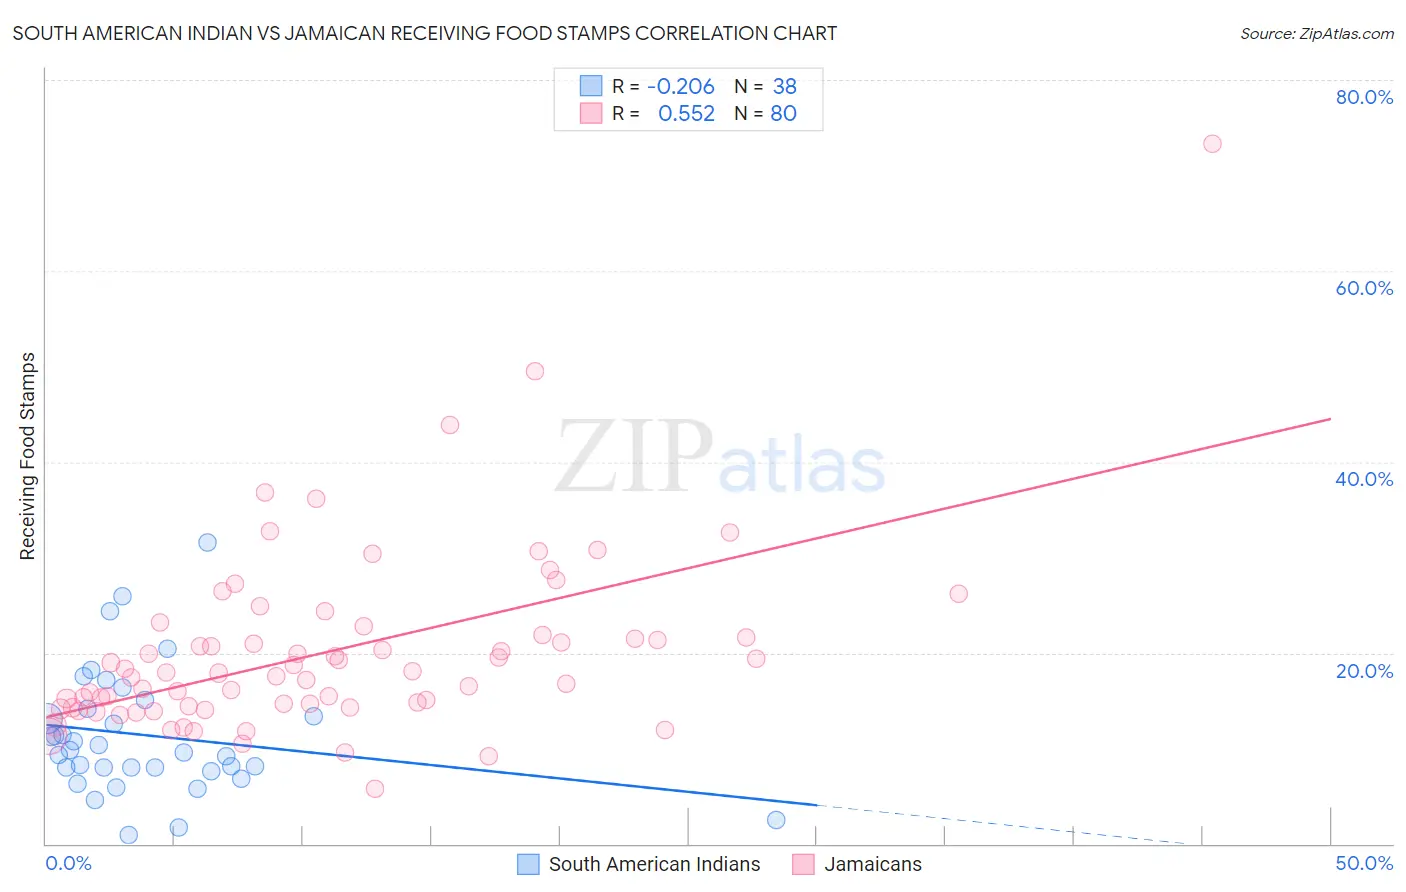
South American Indian vs Jamaican Receiving Food Stamps Correlation Chart

The statistical analysis conducted on geographies consisting of 164,403,103 people shows a weak negative correlation between the proportion of South American Indians and percentage of population receiving government assistance and/or food stamps in the United States with a correlation coefficient (R) of -0.206 and weighted average of 11.9%. Similarly, the statistical analysis conducted on geographies consisting of 367,071,648 people shows a substantial positive correlation between the proportion of Jamaicans and percentage of population receiving government assistance and/or food stamps in the United States with a correlation coefficient (R) of 0.552 and weighted average of 16.4%, a difference of 38.1%.
South American Indian vs Jamaican Receiving Food Stamps

Receiving Food Stamps Correlation Summary

MeasurementSouth American IndianJamaican
Minimum0.90%5.8%
Maximum31.6%73.3%
Range30.7%67.5%
Mean11.3%20.1%
Median9.7%17.9%
Interquartile 25% (IQ1)7.9%14.4%
Interquartile 75% (IQ3)14.1%21.7%
Interquartile Range (IQR)6.2%7.3%
Standard Deviation (Sample)6.6%9.8%
Standard Deviation (Population)6.5%9.7%

Similar Demographics by Receiving Food Stamps

Demographics Similar to South American Indians by Receiving Food Stamps

In terms of receiving food stamps, the demographic groups most similar to South American Indians are Immigrants from Morocco (11.9%, a difference of 0.15%), Immigrants from Uganda (11.9%, a difference of 0.20%), Spaniard (11.9%, a difference of 0.28%), Uruguayan (11.8%, a difference of 0.44%), and Immigrants from Kenya (11.8%, a difference of 0.66%).
DemographicsRating | RankReceiving Food Stamps
Immigrants | Eritrea
50.0
/100
|
#174
Average
11.7%
Osage
49.8
/100
|
#175
Average
11.7%
Peruvians
49.3
/100
|
#176
Average
11.7%
Immigrants | Ukraine
48.4
/100
|
#177
Average
11.8%
German Russians
48.1
/100
|
#178
Average
11.8%
Immigrants | Kenya
46.4
/100
|
#179
Average
11.8%
Uruguayans
44.8
/100
|
#180
Average
11.8%
South American Indians
41.7
/100
|
#181
Average
11.9%
Immigrants | Morocco
40.7
/100
|
#182
Average
11.9%
Immigrants | Uganda
40.3
/100
|
#183
Average
11.9%
Spaniards
39.8
/100
|
#184
Fair
11.9%
Immigrants | Iraq
37.1
/100
|
#185
Fair
12.0%
Spanish
36.9
/100
|
#186
Fair
12.0%
Albanians
35.4
/100
|
#187
Fair
12.0%
Sudanese
33.4
/100
|
#188
Fair
12.0%

Demographics Similar to Jamaicans by Receiving Food Stamps

In terms of receiving food stamps, the demographic groups most similar to Jamaicans are Immigrants from the Azores (16.4%, a difference of 0.070%), Houma (16.5%, a difference of 0.29%), Barbadian (16.5%, a difference of 0.55%), U.S. Virgin Islander (16.5%, a difference of 0.79%), and West Indian (16.3%, a difference of 0.94%).
DemographicsRating | RankReceiving Food Stamps
Hispanics or Latinos
0.0
/100
|
#299
Tragic
15.8%
Immigrants | Bangladesh
0.0
/100
|
#300
Tragic
15.9%
Trinidadians and Tobagonians
0.0
/100
|
#301
Tragic
16.0%
Immigrants | West Indies
0.0
/100
|
#302
Tragic
16.1%
Nicaraguans
0.0
/100
|
#303
Tragic
16.1%
West Indians
0.0
/100
|
#304
Tragic
16.3%
Immigrants | Azores
0.0
/100
|
#305
Tragic
16.4%
Jamaicans
0.0
/100
|
#306
Tragic
16.4%
Houma
0.0
/100
|
#307
Tragic
16.5%
Barbadians
0.0
/100
|
#308
Tragic
16.5%
U.S. Virgin Islanders
0.0
/100
|
#309
Tragic
16.5%
Immigrants | Barbados
0.0
/100
|
#310
Tragic
16.6%
Guyanese
0.0
/100
|
#311
Tragic
16.7%
Sioux
0.0
/100
|
#312
Tragic
16.8%
Immigrants | Jamaica
0.0
/100
|
#313
Tragic
16.9%