South American Indian vs Immigrants from Syria Unemployment Among Women with Children Under 6 years
COMPARE
South American Indian
Immigrants from Syria
Unemployment Among Women with Children Under 6 years
Unemployment Among Women with Children Under 6 years Comparison
South American Indians
Immigrants from Syria
7.9%
UNEMPLOYMENT AMONG WOMEN WITH CHILDREN UNDER 6 YEARS
9.3/ 100
METRIC RATING
220th/ 347
METRIC RANK
7.8%
UNEMPLOYMENT AMONG WOMEN WITH CHILDREN UNDER 6 YEARS
18.9/ 100
METRIC RATING
208th/ 347
METRIC RANK
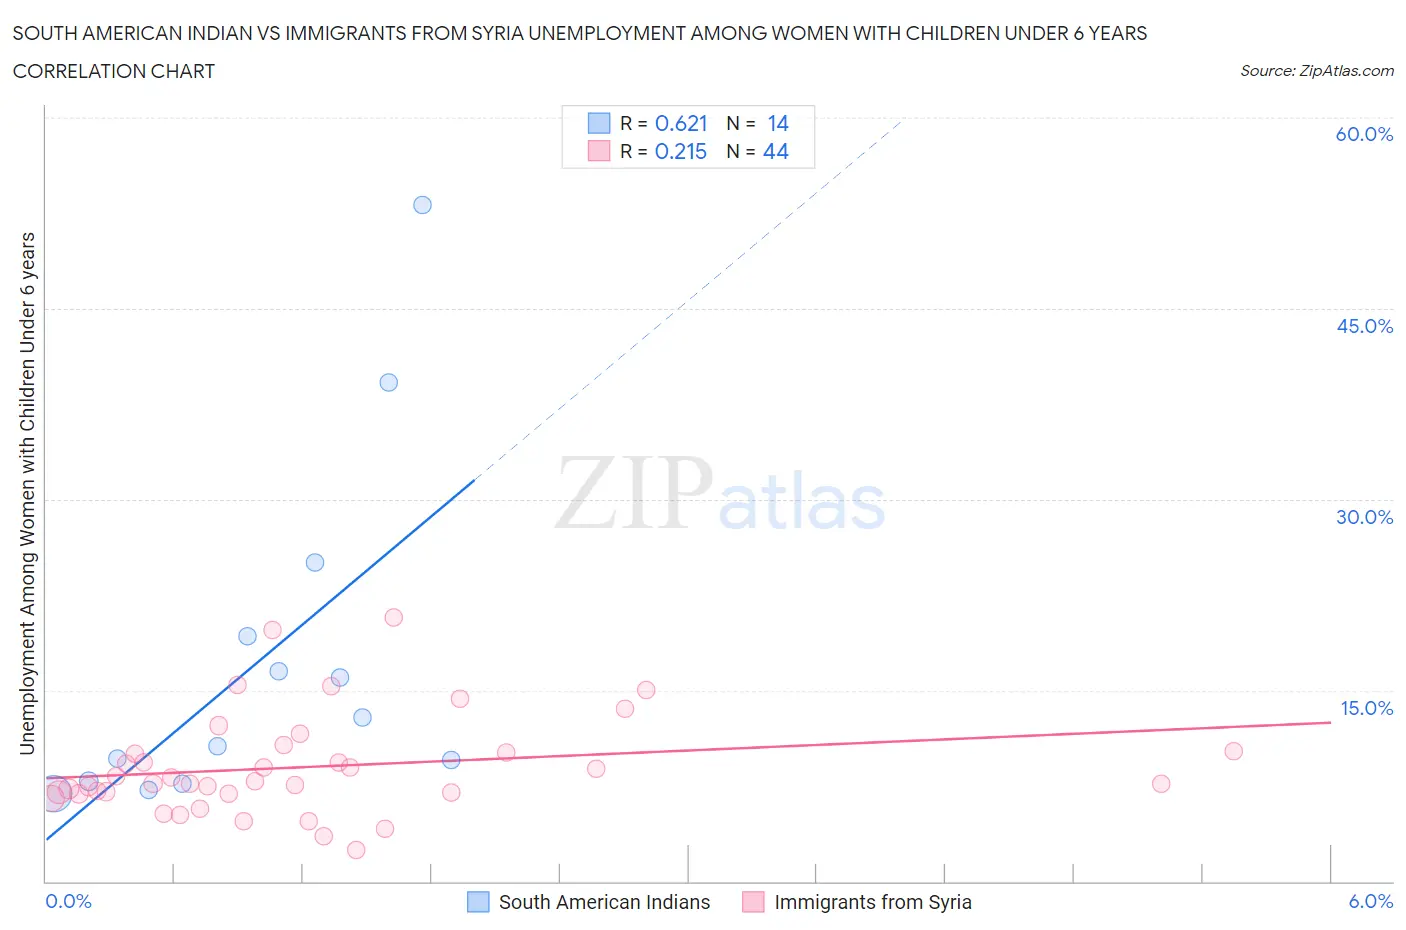
South American Indian vs Immigrants from Syria Unemployment Among Women with Children Under 6 years Correlation Chart
The statistical analysis conducted on geographies consisting of 145,192,635 people shows a significant positive correlation between the proportion of South American Indians and unemployment rate among women with children under the age of 6 in the United States with a correlation coefficient (R) of 0.621 and weighted average of 7.9%. Similarly, the statistical analysis conducted on geographies consisting of 150,011,263 people shows a weak positive correlation between the proportion of Immigrants from Syria and unemployment rate among women with children under the age of 6 in the United States with a correlation coefficient (R) of 0.215 and weighted average of 7.8%, a difference of 1.3%.
Unemployment Among Women with Children Under 6 years Correlation Summary
| Measurement | South American Indian | Immigrants from Syria |
| Minimum | 6.8% | 2.5% |
| Maximum | 53.1% | 20.7% |
| Range | 46.3% | 18.2% |
| Mean | 17.2% | 9.0% |
| Median | 11.7% | 7.8% |
| Interquartile 25% (IQ1) | 7.9% | 6.9% |
| Interquartile 75% (IQ3) | 19.2% | 10.2% |
| Interquartile Range (IQR) | 11.4% | 3.3% |
| Standard Deviation (Sample) | 13.6% | 3.9% |
| Standard Deviation (Population) | 13.1% | 3.9% |
Demographics Similar to South American Indians and Immigrants from Syria by Unemployment Among Women with Children Under 6 years
In terms of unemployment among women with children under 6 years, the demographic groups most similar to South American Indians are Arab (7.9%, a difference of 0.020%), Moroccan (7.9%, a difference of 0.090%), Immigrants from Germany (7.9%, a difference of 0.16%), Samoan (7.9%, a difference of 0.18%), and Immigrants from Nigeria (7.9%, a difference of 0.19%). Similarly, the demographic groups most similar to Immigrants from Syria are Costa Rican (7.8%, a difference of 0.14%), Canadian (7.8%, a difference of 0.18%), Hungarian (7.8%, a difference of 0.23%), Immigrants (7.8%, a difference of 0.25%), and Polish (7.9%, a difference of 0.32%).
| Demographics | Rating | Rank | Unemployment Among Women with Children Under 6 years |
| Lebanese | 22.2 /100 | #204 | Fair 7.8% |
| Immigrants | Immigrants | 21.4 /100 | #205 | Fair 7.8% |
| Hungarians | 21.2 /100 | #206 | Fair 7.8% |
| Canadians | 20.6 /100 | #207 | Fair 7.8% |
| Immigrants | Syria | 18.9 /100 | #208 | Poor 7.8% |
| Costa Ricans | 17.6 /100 | #209 | Poor 7.8% |
| Poles | 16.0 /100 | #210 | Poor 7.9% |
| Immigrants | Ecuador | 14.9 /100 | #211 | Poor 7.9% |
| Swiss | 12.3 /100 | #212 | Poor 7.9% |
| Scottish | 11.4 /100 | #213 | Poor 7.9% |
| Spanish | 11.3 /100 | #214 | Poor 7.9% |
| Ecuadorians | 11.2 /100 | #215 | Poor 7.9% |
| Immigrants | Lebanon | 11.1 /100 | #216 | Poor 7.9% |
| Immigrants | Nigeria | 10.3 /100 | #217 | Poor 7.9% |
| Moroccans | 9.7 /100 | #218 | Tragic 7.9% |
| Arabs | 9.4 /100 | #219 | Tragic 7.9% |
| South American Indians | 9.3 /100 | #220 | Tragic 7.9% |
| Immigrants | Germany | 8.5 /100 | #221 | Tragic 7.9% |
| Samoans | 8.4 /100 | #222 | Tragic 7.9% |
| Carpatho Rusyns | 7.8 /100 | #223 | Tragic 8.0% |
| English | 7.2 /100 | #224 | Tragic 8.0% |