South American Indian vs Irish Receiving Food Stamps
COMPARE
South American Indian
Irish
Receiving Food Stamps
Receiving Food Stamps Comparison
South American Indians
Irish
11.9%
RECEIVING FOOD STAMPS
41.7/ 100
METRIC RATING
181st/ 347
METRIC RANK
10.2%
RECEIVING FOOD STAMPS
97.9/ 100
METRIC RATING
92nd/ 347
METRIC RANK
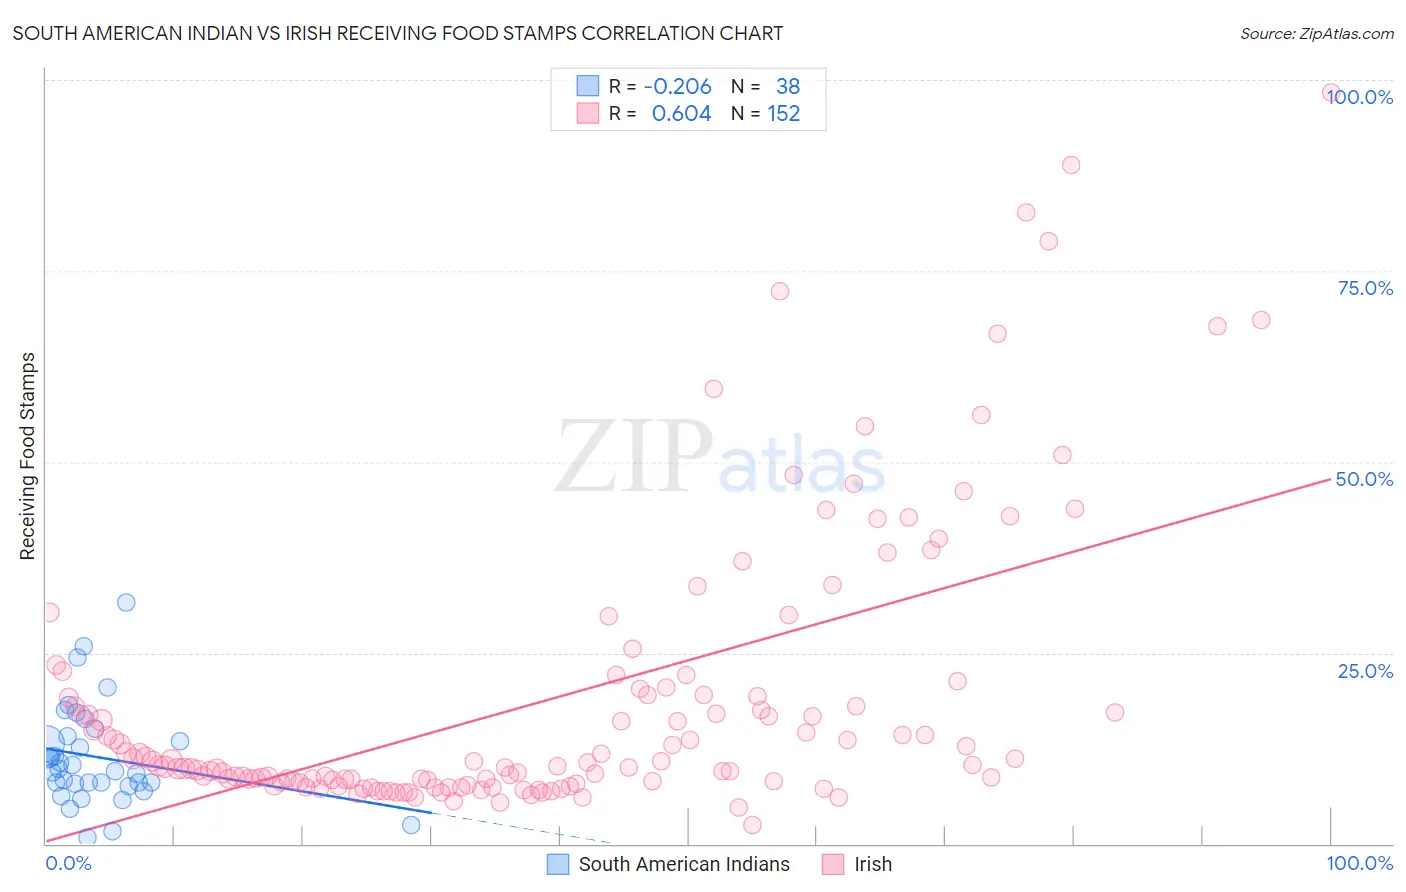
South American Indian vs Irish Receiving Food Stamps Correlation Chart
The statistical analysis conducted on geographies consisting of 164,403,103 people shows a weak negative correlation between the proportion of South American Indians and percentage of population receiving government assistance and/or food stamps in the United States with a correlation coefficient (R) of -0.206 and weighted average of 11.9%. Similarly, the statistical analysis conducted on geographies consisting of 576,263,816 people shows a significant positive correlation between the proportion of Irish and percentage of population receiving government assistance and/or food stamps in the United States with a correlation coefficient (R) of 0.604 and weighted average of 10.2%, a difference of 16.9%.
Receiving Food Stamps Correlation Summary
| Measurement | South American Indian | Irish |
| Minimum | 0.90% | 2.5% |
| Maximum | 31.6% | 98.4% |
| Range | 30.7% | 95.9% |
| Mean | 11.3% | 18.8% |
| Median | 9.7% | 10.3% |
| Interquartile 25% (IQ1) | 7.9% | 8.1% |
| Interquartile 75% (IQ3) | 14.1% | 19.4% |
| Interquartile Range (IQR) | 6.2% | 11.3% |
| Standard Deviation (Sample) | 6.6% | 18.6% |
| Standard Deviation (Population) | 6.5% | 18.6% |
Similar Demographics by Receiving Food Stamps
Demographics Similar to South American Indians by Receiving Food Stamps
In terms of receiving food stamps, the demographic groups most similar to South American Indians are Immigrants from Morocco (11.9%, a difference of 0.15%), Immigrants from Uganda (11.9%, a difference of 0.20%), Spaniard (11.9%, a difference of 0.28%), Uruguayan (11.8%, a difference of 0.44%), and Immigrants from Kenya (11.8%, a difference of 0.66%).
| Demographics | Rating | Rank | Receiving Food Stamps |
| Immigrants | Eritrea | 50.0 /100 | #174 | Average 11.7% |
| Osage | 49.8 /100 | #175 | Average 11.7% |
| Peruvians | 49.3 /100 | #176 | Average 11.7% |
| Immigrants | Ukraine | 48.4 /100 | #177 | Average 11.8% |
| German Russians | 48.1 /100 | #178 | Average 11.8% |
| Immigrants | Kenya | 46.4 /100 | #179 | Average 11.8% |
| Uruguayans | 44.8 /100 | #180 | Average 11.8% |
| South American Indians | 41.7 /100 | #181 | Average 11.9% |
| Immigrants | Morocco | 40.7 /100 | #182 | Average 11.9% |
| Immigrants | Uganda | 40.3 /100 | #183 | Average 11.9% |
| Spaniards | 39.8 /100 | #184 | Fair 11.9% |
| Immigrants | Iraq | 37.1 /100 | #185 | Fair 12.0% |
| Spanish | 36.9 /100 | #186 | Fair 12.0% |
| Albanians | 35.4 /100 | #187 | Fair 12.0% |
| Sudanese | 33.4 /100 | #188 | Fair 12.0% |
Demographics Similar to Irish by Receiving Food Stamps
In terms of receiving food stamps, the demographic groups most similar to Irish are Jordanian (10.2%, a difference of 0.0%), Finnish (10.2%, a difference of 0.040%), Belgian (10.2%, a difference of 0.38%), Immigrants from France (10.1%, a difference of 0.89%), and Immigrants from Greece (10.3%, a difference of 0.91%).
| Demographics | Rating | Rank | Receiving Food Stamps |
| Immigrants | Romania | 98.5 /100 | #85 | Exceptional 10.0% |
| Immigrants | Norway | 98.4 /100 | #86 | Exceptional 10.0% |
| Egyptians | 98.4 /100 | #87 | Exceptional 10.0% |
| Immigrants | Kuwait | 98.4 /100 | #88 | Exceptional 10.0% |
| Immigrants | France | 98.3 /100 | #89 | Exceptional 10.1% |
| Finns | 97.9 /100 | #90 | Exceptional 10.2% |
| Jordanians | 97.9 /100 | #91 | Exceptional 10.2% |
| Irish | 97.9 /100 | #92 | Exceptional 10.2% |
| Belgians | 97.7 /100 | #93 | Exceptional 10.2% |
| Immigrants | Greece | 97.4 /100 | #94 | Exceptional 10.3% |
| Basques | 97.4 /100 | #95 | Exceptional 10.3% |
| Welsh | 97.3 /100 | #96 | Exceptional 10.3% |
| Czechoslovakians | 97.2 /100 | #97 | Exceptional 10.3% |
| Immigrants | Egypt | 97.1 /100 | #98 | Exceptional 10.3% |
| Serbians | 97.0 /100 | #99 | Exceptional 10.3% |