South American Indian vs Pennsylvania German Receiving Food Stamps
COMPARE
South American Indian
Pennsylvania German
Receiving Food Stamps
Receiving Food Stamps Comparison
South American Indians
Pennsylvania Germans
11.9%
RECEIVING FOOD STAMPS
41.7/ 100
METRIC RATING
181st/ 347
METRIC RANK
11.4%
RECEIVING FOOD STAMPS
68.4/ 100
METRIC RATING
161st/ 347
METRIC RANK
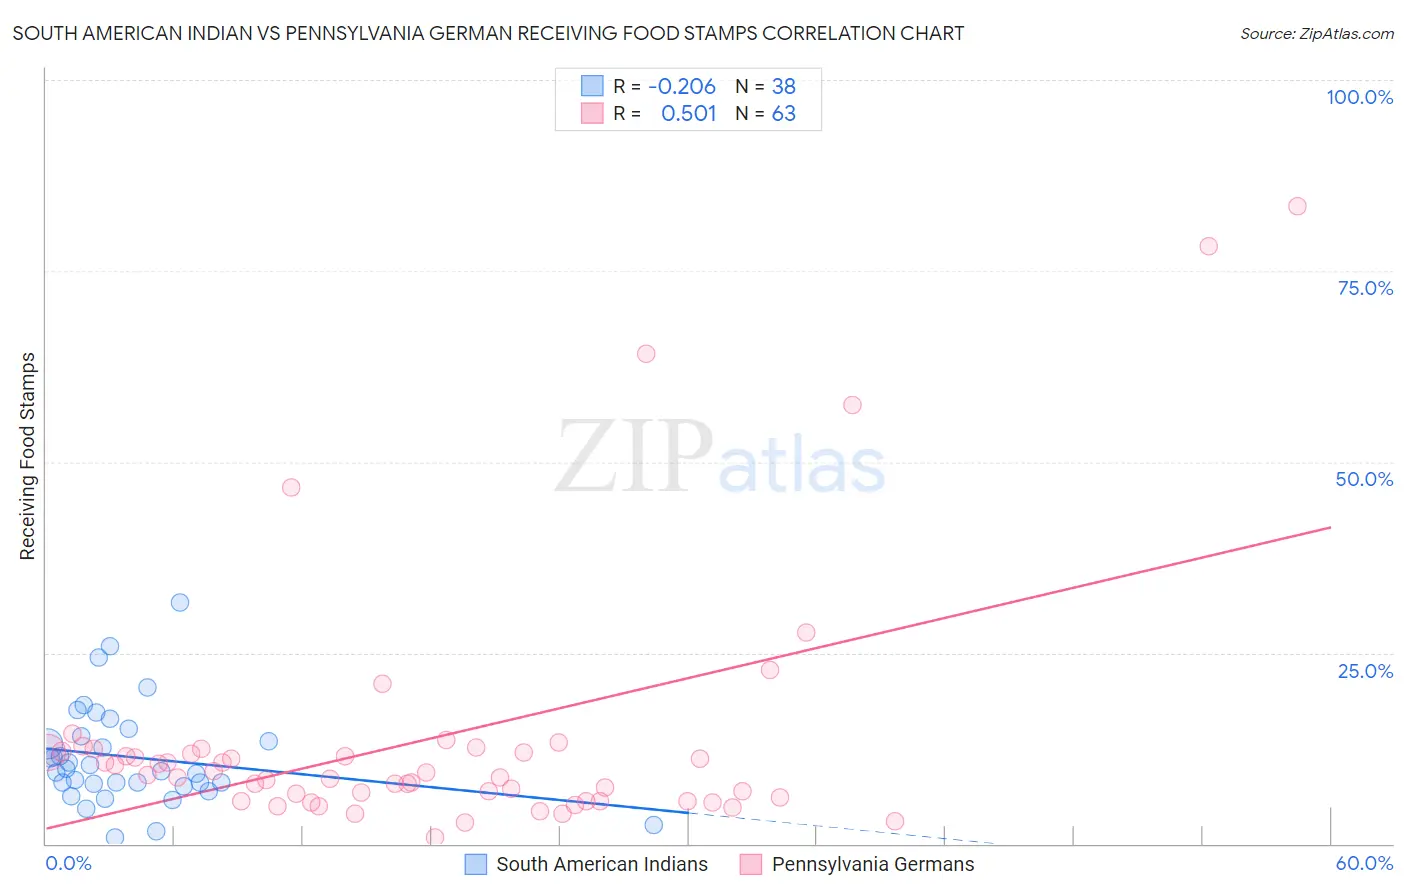
South American Indian vs Pennsylvania German Receiving Food Stamps Correlation Chart
The statistical analysis conducted on geographies consisting of 164,403,103 people shows a weak negative correlation between the proportion of South American Indians and percentage of population receiving government assistance and/or food stamps in the United States with a correlation coefficient (R) of -0.206 and weighted average of 11.9%. Similarly, the statistical analysis conducted on geographies consisting of 233,858,684 people shows a substantial positive correlation between the proportion of Pennsylvania Germans and percentage of population receiving government assistance and/or food stamps in the United States with a correlation coefficient (R) of 0.501 and weighted average of 11.4%, a difference of 4.0%.
Receiving Food Stamps Correlation Summary
| Measurement | South American Indian | Pennsylvania German |
| Minimum | 0.90% | 0.90% |
| Maximum | 31.6% | 83.5% |
| Range | 30.7% | 82.6% |
| Mean | 11.3% | 13.7% |
| Median | 9.7% | 8.9% |
| Interquartile 25% (IQ1) | 7.9% | 5.6% |
| Interquartile 75% (IQ3) | 14.1% | 12.0% |
| Interquartile Range (IQR) | 6.2% | 6.4% |
| Standard Deviation (Sample) | 6.6% | 16.6% |
| Standard Deviation (Population) | 6.5% | 16.4% |
Demographics Similar to South American Indians and Pennsylvania Germans by Receiving Food Stamps
In terms of receiving food stamps, the demographic groups most similar to South American Indians are Uruguayan (11.8%, a difference of 0.44%), Immigrants from Kenya (11.8%, a difference of 0.66%), German Russian (11.8%, a difference of 0.90%), Immigrants from Ukraine (11.8%, a difference of 0.94%), and Peruvian (11.7%, a difference of 1.1%). Similarly, the demographic groups most similar to Pennsylvania Germans are Alsatian (11.4%, a difference of 0.060%), Immigrants from Southern Europe (11.5%, a difference of 0.43%), Immigrants from Chile (11.5%, a difference of 0.55%), Arab (11.5%, a difference of 0.60%), and Immigrants from Belarus (11.5%, a difference of 0.90%).
| Demographics | Rating | Rank | Receiving Food Stamps |
| Pennsylvania Germans | 68.4 /100 | #161 | Good 11.4% |
| Alsatians | 68.0 /100 | #162 | Good 11.4% |
| Immigrants | Southern Europe | 65.8 /100 | #163 | Good 11.5% |
| Immigrants | Chile | 65.0 /100 | #164 | Good 11.5% |
| Arabs | 64.7 /100 | #165 | Good 11.5% |
| Immigrants | Belarus | 62.8 /100 | #166 | Good 11.5% |
| Kenyans | 60.2 /100 | #167 | Good 11.6% |
| Tlingit-Haida | 59.1 /100 | #168 | Average 11.6% |
| Immigrants | Eastern Africa | 58.3 /100 | #169 | Average 11.6% |
| Costa Ricans | 57.9 /100 | #170 | Average 11.6% |
| Immigrants | Western Asia | 56.4 /100 | #171 | Average 11.6% |
| Guamanians/Chamorros | 54.2 /100 | #172 | Average 11.7% |
| Immigrants | Syria | 53.4 /100 | #173 | Average 11.7% |
| Immigrants | Eritrea | 50.0 /100 | #174 | Average 11.7% |
| Osage | 49.8 /100 | #175 | Average 11.7% |
| Peruvians | 49.3 /100 | #176 | Average 11.7% |
| Immigrants | Ukraine | 48.4 /100 | #177 | Average 11.8% |
| German Russians | 48.1 /100 | #178 | Average 11.8% |
| Immigrants | Kenya | 46.4 /100 | #179 | Average 11.8% |
| Uruguayans | 44.8 /100 | #180 | Average 11.8% |
| South American Indians | 41.7 /100 | #181 | Average 11.9% |