South African vs Immigrants from Moldova Male Poverty
COMPARE
South African
Immigrants from Moldova
Male Poverty
Male Poverty Comparison
South Africans
Immigrants from Moldova
10.7%
MALE POVERTY
86.8/ 100
METRIC RATING
123rd/ 347
METRIC RANK
9.9%
MALE POVERTY
99.0/ 100
METRIC RATING
43rd/ 347
METRIC RANK
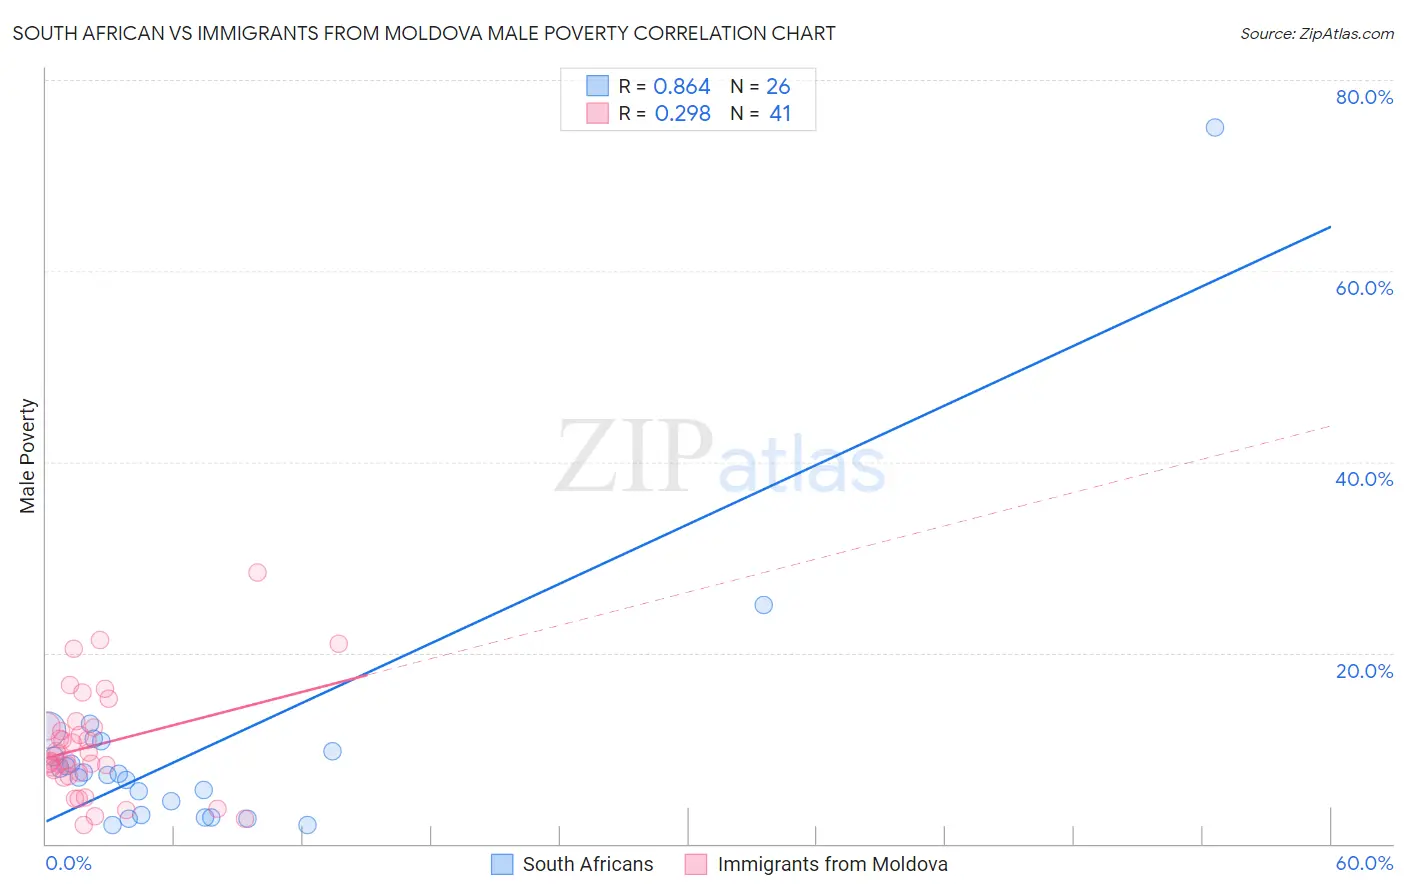
South African vs Immigrants from Moldova Male Poverty Correlation Chart
The statistical analysis conducted on geographies consisting of 182,517,352 people shows a very strong positive correlation between the proportion of South Africans and poverty level among males in the United States with a correlation coefficient (R) of 0.864 and weighted average of 10.7%. Similarly, the statistical analysis conducted on geographies consisting of 124,352,223 people shows a weak positive correlation between the proportion of Immigrants from Moldova and poverty level among males in the United States with a correlation coefficient (R) of 0.298 and weighted average of 9.9%, a difference of 7.5%.
Male Poverty Correlation Summary
| Measurement | South African | Immigrants from Moldova |
| Minimum | 2.0% | 1.9% |
| Maximum | 75.0% | 28.4% |
| Range | 73.0% | 26.5% |
| Mean | 9.9% | 10.3% |
| Median | 7.2% | 8.8% |
| Interquartile 25% (IQ1) | 3.0% | 7.2% |
| Interquartile 75% (IQ3) | 9.7% | 12.2% |
| Interquartile Range (IQR) | 6.6% | 5.0% |
| Standard Deviation (Sample) | 14.1% | 5.6% |
| Standard Deviation (Population) | 13.8% | 5.5% |
Similar Demographics by Male Poverty
Demographics Similar to South Africans by Male Poverty
In terms of male poverty, the demographic groups most similar to South Africans are French (10.7%, a difference of 0.030%), Native Hawaiian (10.7%, a difference of 0.040%), Peruvian (10.7%, a difference of 0.060%), Immigrants from China (10.7%, a difference of 0.070%), and Immigrants from Hungary (10.7%, a difference of 0.17%).
| Demographics | Rating | Rank | Male Poverty |
| Sri Lankans | 88.1 /100 | #116 | Excellent 10.6% |
| Immigrants | South Eastern Asia | 88.1 /100 | #117 | Excellent 10.6% |
| Okinawans | 87.6 /100 | #118 | Excellent 10.7% |
| Immigrants | Hungary | 87.6 /100 | #119 | Excellent 10.7% |
| Immigrants | China | 87.1 /100 | #120 | Excellent 10.7% |
| Peruvians | 87.1 /100 | #121 | Excellent 10.7% |
| Native Hawaiians | 87.0 /100 | #122 | Excellent 10.7% |
| South Africans | 86.8 /100 | #123 | Excellent 10.7% |
| French | 86.7 /100 | #124 | Excellent 10.7% |
| Immigrants | Norway | 86.0 /100 | #125 | Excellent 10.7% |
| Immigrants | Ukraine | 84.3 /100 | #126 | Excellent 10.7% |
| Puget Sound Salish | 84.3 /100 | #127 | Excellent 10.7% |
| Immigrants | Western Europe | 84.2 /100 | #128 | Excellent 10.7% |
| Immigrants | Peru | 84.1 /100 | #129 | Excellent 10.7% |
| Chileans | 83.9 /100 | #130 | Excellent 10.7% |
Demographics Similar to Immigrants from Moldova by Male Poverty
In terms of male poverty, the demographic groups most similar to Immigrants from Moldova are Immigrants from Romania (9.9%, a difference of 0.22%), Immigrants from Iran (9.9%, a difference of 0.26%), Immigrants from Serbia (10.0%, a difference of 0.40%), Turkish (10.0%, a difference of 0.42%), and Korean (9.9%, a difference of 0.50%).
| Demographics | Rating | Rank | Male Poverty |
| Czechs | 99.4 /100 | #36 | Exceptional 9.8% |
| Immigrants | Greece | 99.3 /100 | #37 | Exceptional 9.8% |
| Immigrants | Pakistan | 99.2 /100 | #38 | Exceptional 9.9% |
| Russians | 99.2 /100 | #39 | Exceptional 9.9% |
| Cypriots | 99.2 /100 | #40 | Exceptional 9.9% |
| Koreans | 99.2 /100 | #41 | Exceptional 9.9% |
| Immigrants | Iran | 99.1 /100 | #42 | Exceptional 9.9% |
| Immigrants | Moldova | 99.0 /100 | #43 | Exceptional 9.9% |
| Immigrants | Romania | 98.9 /100 | #44 | Exceptional 9.9% |
| Immigrants | Serbia | 98.9 /100 | #45 | Exceptional 10.0% |
| Turks | 98.9 /100 | #46 | Exceptional 10.0% |
| Immigrants | Singapore | 98.8 /100 | #47 | Exceptional 10.0% |
| Immigrants | Japan | 98.8 /100 | #48 | Exceptional 10.0% |
| Slovenes | 98.8 /100 | #49 | Exceptional 10.0% |
| Immigrants | Philippines | 98.7 /100 | #50 | Exceptional 10.0% |