South African vs Spanish American Indian Male Poverty
COMPARE
South African
Spanish American Indian
Male Poverty
Male Poverty Comparison
South Africans
Spanish American Indians
10.7%
MALE POVERTY
86.8/ 100
METRIC RATING
123rd/ 347
METRIC RANK
13.1%
MALE POVERTY
0.1/ 100
METRIC RATING
262nd/ 347
METRIC RANK
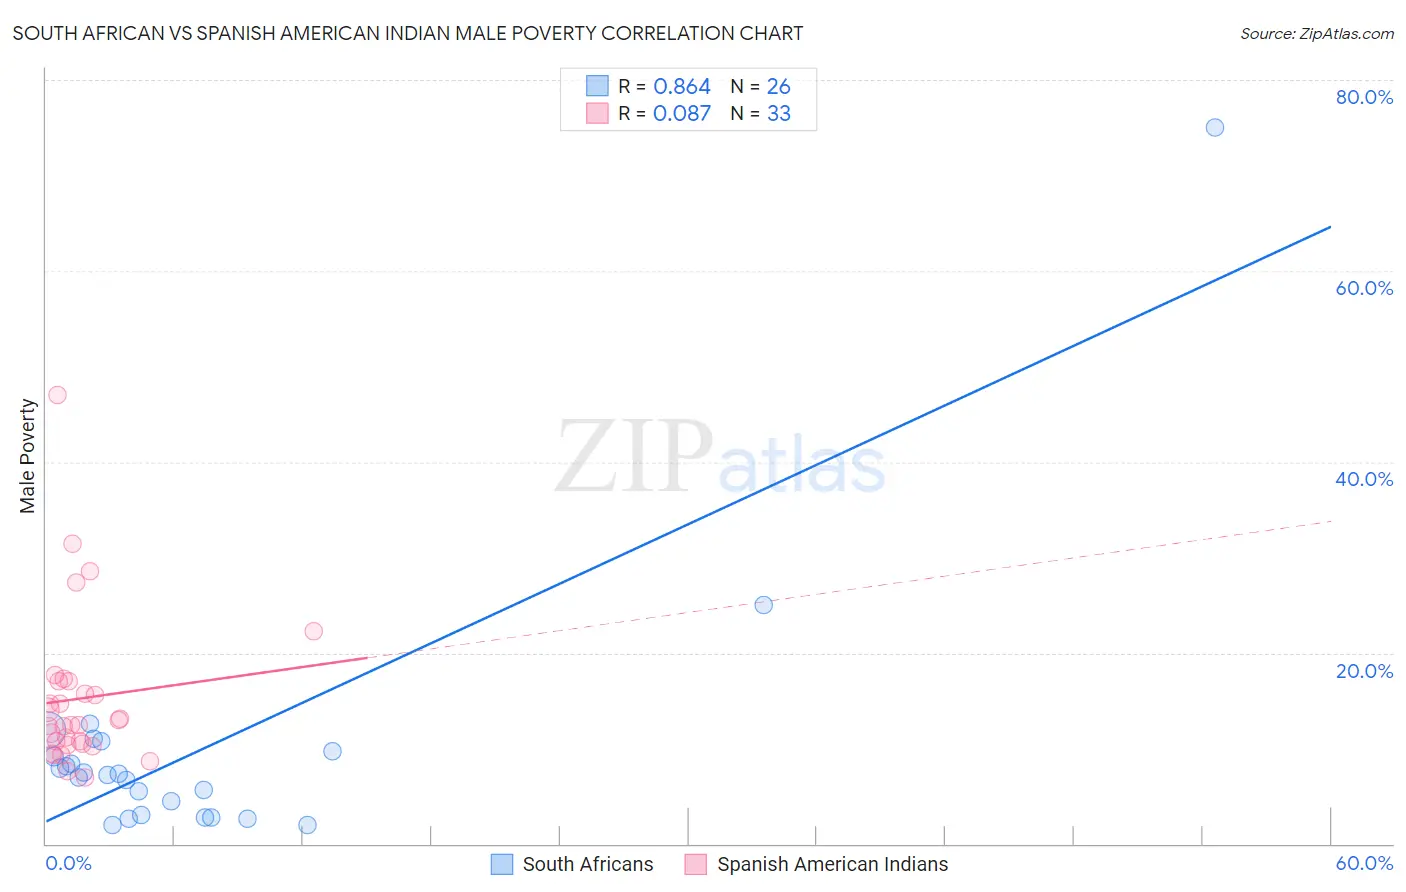
South African vs Spanish American Indian Male Poverty Correlation Chart
The statistical analysis conducted on geographies consisting of 182,517,352 people shows a very strong positive correlation between the proportion of South Africans and poverty level among males in the United States with a correlation coefficient (R) of 0.864 and weighted average of 10.7%. Similarly, the statistical analysis conducted on geographies consisting of 73,141,857 people shows a slight positive correlation between the proportion of Spanish American Indians and poverty level among males in the United States with a correlation coefficient (R) of 0.087 and weighted average of 13.1%, a difference of 22.9%.
Male Poverty Correlation Summary
| Measurement | South African | Spanish American Indian |
| Minimum | 2.0% | 6.9% |
| Maximum | 75.0% | 47.0% |
| Range | 73.0% | 40.0% |
| Mean | 9.9% | 15.2% |
| Median | 7.2% | 12.4% |
| Interquartile 25% (IQ1) | 3.0% | 10.4% |
| Interquartile 75% (IQ3) | 9.7% | 17.0% |
| Interquartile Range (IQR) | 6.6% | 6.6% |
| Standard Deviation (Sample) | 14.1% | 8.1% |
| Standard Deviation (Population) | 13.8% | 8.0% |
Similar Demographics by Male Poverty
Demographics Similar to South Africans by Male Poverty
In terms of male poverty, the demographic groups most similar to South Africans are French (10.7%, a difference of 0.030%), Native Hawaiian (10.7%, a difference of 0.040%), Peruvian (10.7%, a difference of 0.060%), Immigrants from China (10.7%, a difference of 0.070%), and Immigrants from Hungary (10.7%, a difference of 0.17%).
| Demographics | Rating | Rank | Male Poverty |
| Sri Lankans | 88.1 /100 | #116 | Excellent 10.6% |
| Immigrants | South Eastern Asia | 88.1 /100 | #117 | Excellent 10.6% |
| Okinawans | 87.6 /100 | #118 | Excellent 10.7% |
| Immigrants | Hungary | 87.6 /100 | #119 | Excellent 10.7% |
| Immigrants | China | 87.1 /100 | #120 | Excellent 10.7% |
| Peruvians | 87.1 /100 | #121 | Excellent 10.7% |
| Native Hawaiians | 87.0 /100 | #122 | Excellent 10.7% |
| South Africans | 86.8 /100 | #123 | Excellent 10.7% |
| French | 86.7 /100 | #124 | Excellent 10.7% |
| Immigrants | Norway | 86.0 /100 | #125 | Excellent 10.7% |
| Immigrants | Ukraine | 84.3 /100 | #126 | Excellent 10.7% |
| Puget Sound Salish | 84.3 /100 | #127 | Excellent 10.7% |
| Immigrants | Western Europe | 84.2 /100 | #128 | Excellent 10.7% |
| Immigrants | Peru | 84.1 /100 | #129 | Excellent 10.7% |
| Chileans | 83.9 /100 | #130 | Excellent 10.7% |
Demographics Similar to Spanish American Indians by Male Poverty
In terms of male poverty, the demographic groups most similar to Spanish American Indians are Trinidadian and Tobagonian (13.1%, a difference of 0.050%), Ottawa (13.1%, a difference of 0.070%), Cherokee (13.1%, a difference of 0.18%), Cape Verdean (13.1%, a difference of 0.35%), and Central American (13.2%, a difference of 0.40%).
| Demographics | Rating | Rank | Male Poverty |
| Immigrants | Liberia | 0.1 /100 | #255 | Tragic 13.0% |
| Immigrants | Burma/Myanmar | 0.1 /100 | #256 | Tragic 13.0% |
| Immigrants | Trinidad and Tobago | 0.1 /100 | #257 | Tragic 13.1% |
| Cape Verdeans | 0.1 /100 | #258 | Tragic 13.1% |
| Cherokee | 0.1 /100 | #259 | Tragic 13.1% |
| Ottawa | 0.1 /100 | #260 | Tragic 13.1% |
| Trinidadians and Tobagonians | 0.1 /100 | #261 | Tragic 13.1% |
| Spanish American Indians | 0.1 /100 | #262 | Tragic 13.1% |
| Central Americans | 0.1 /100 | #263 | Tragic 13.2% |
| Iroquois | 0.1 /100 | #264 | Tragic 13.2% |
| Jamaicans | 0.1 /100 | #265 | Tragic 13.2% |
| Immigrants | Guyana | 0.1 /100 | #266 | Tragic 13.2% |
| Immigrants | Jamaica | 0.1 /100 | #267 | Tragic 13.3% |
| Sub-Saharan Africans | 0.1 /100 | #268 | Tragic 13.3% |
| Guyanese | 0.0 /100 | #269 | Tragic 13.3% |