South African vs Immigrants from Burma/Myanmar Family Poverty
COMPARE
South African
Immigrants from Burma/Myanmar
Family Poverty
Family Poverty Comparison
South Africans
Immigrants from Burma/Myanmar
8.2%
FAMILY POVERTY
93.4/ 100
METRIC RATING
116th/ 347
METRIC RANK
10.5%
FAMILY POVERTY
0.6/ 100
METRIC RATING
245th/ 347
METRIC RANK
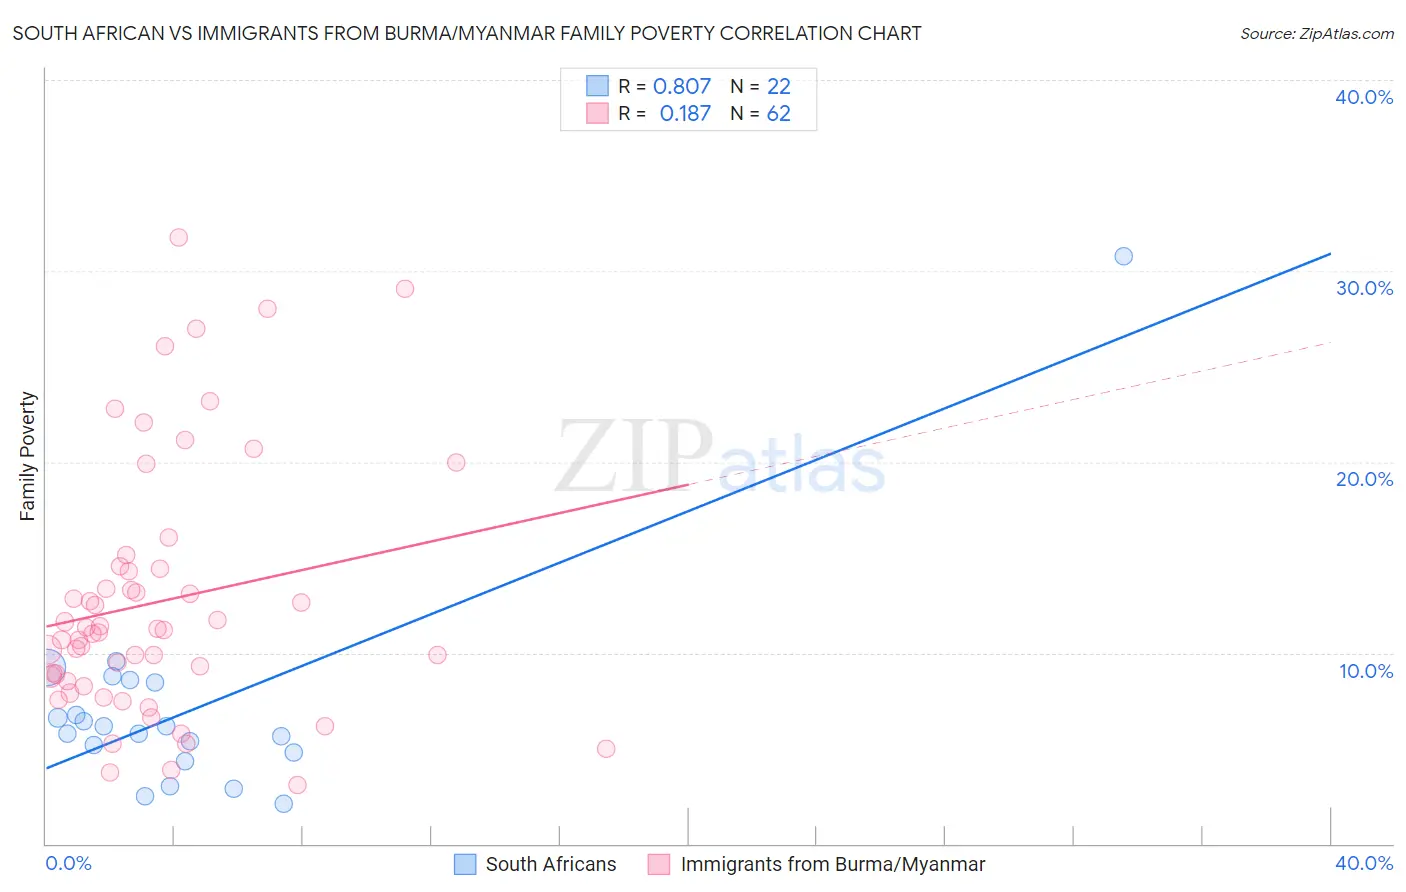
South African vs Immigrants from Burma/Myanmar Family Poverty Correlation Chart
The statistical analysis conducted on geographies consisting of 182,354,069 people shows a very strong positive correlation between the proportion of South Africans and poverty level among families in the United States with a correlation coefficient (R) of 0.807 and weighted average of 8.2%. Similarly, the statistical analysis conducted on geographies consisting of 172,175,970 people shows a poor positive correlation between the proportion of Immigrants from Burma/Myanmar and poverty level among families in the United States with a correlation coefficient (R) of 0.187 and weighted average of 10.5%, a difference of 28.0%.
Family Poverty Correlation Summary
| Measurement | South African | Immigrants from Burma/Myanmar |
| Minimum | 2.1% | 3.0% |
| Maximum | 30.8% | 31.7% |
| Range | 28.7% | 28.7% |
| Mean | 7.0% | 12.7% |
| Median | 6.0% | 11.1% |
| Interquartile 25% (IQ1) | 4.8% | 8.5% |
| Interquartile 75% (IQ3) | 8.4% | 14.4% |
| Interquartile Range (IQR) | 3.7% | 5.8% |
| Standard Deviation (Sample) | 5.7% | 6.6% |
| Standard Deviation (Population) | 5.6% | 6.6% |
Similar Demographics by Family Poverty
Demographics Similar to South Africans by Family Poverty
In terms of family poverty, the demographic groups most similar to South Africans are Immigrants from Israel (8.2%, a difference of 0.060%), Immigrants from Russia (8.2%, a difference of 0.070%), Immigrants from Western Europe (8.2%, a difference of 0.26%), French (8.3%, a difference of 0.33%), and Immigrants from Zimbabwe (8.2%, a difference of 0.41%).
| Demographics | Rating | Rank | Family Poverty |
| Jordanians | 94.8 /100 | #109 | Exceptional 8.2% |
| Romanians | 94.7 /100 | #110 | Exceptional 8.2% |
| Taiwanese | 94.6 /100 | #111 | Exceptional 8.2% |
| Immigrants | France | 94.4 /100 | #112 | Exceptional 8.2% |
| Canadians | 94.2 /100 | #113 | Exceptional 8.2% |
| Immigrants | Zimbabwe | 94.0 /100 | #114 | Exceptional 8.2% |
| Immigrants | Israel | 93.5 /100 | #115 | Exceptional 8.2% |
| South Africans | 93.4 /100 | #116 | Exceptional 8.2% |
| Immigrants | Russia | 93.2 /100 | #117 | Exceptional 8.2% |
| Immigrants | Western Europe | 92.9 /100 | #118 | Exceptional 8.2% |
| French | 92.8 /100 | #119 | Exceptional 8.3% |
| Immigrants | Egypt | 91.6 /100 | #120 | Exceptional 8.3% |
| Native Hawaiians | 91.3 /100 | #121 | Exceptional 8.3% |
| Paraguayans | 91.2 /100 | #122 | Exceptional 8.3% |
| Palestinians | 91.1 /100 | #123 | Exceptional 8.3% |
Demographics Similar to Immigrants from Burma/Myanmar by Family Poverty
In terms of family poverty, the demographic groups most similar to Immigrants from Burma/Myanmar are Cree (10.5%, a difference of 0.61%), Cherokee (10.6%, a difference of 0.64%), Liberian (10.6%, a difference of 0.73%), Nicaraguan (10.6%, a difference of 0.93%), and Cuban (10.6%, a difference of 0.98%).
| Demographics | Rating | Rank | Family Poverty |
| French American Indians | 1.5 /100 | #238 | Tragic 10.2% |
| Potawatomi | 1.5 /100 | #239 | Tragic 10.2% |
| Immigrants | Azores | 1.4 /100 | #240 | Tragic 10.3% |
| Ghanaians | 1.3 /100 | #241 | Tragic 10.3% |
| Alaska Natives | 1.0 /100 | #242 | Tragic 10.4% |
| Nepalese | 0.8 /100 | #243 | Tragic 10.4% |
| Cree | 0.7 /100 | #244 | Tragic 10.5% |
| Immigrants | Burma/Myanmar | 0.6 /100 | #245 | Tragic 10.5% |
| Cherokee | 0.5 /100 | #246 | Tragic 10.6% |
| Liberians | 0.4 /100 | #247 | Tragic 10.6% |
| Nicaraguans | 0.4 /100 | #248 | Tragic 10.6% |
| Cubans | 0.4 /100 | #249 | Tragic 10.6% |
| Salvadorans | 0.3 /100 | #250 | Tragic 10.7% |
| Iroquois | 0.3 /100 | #251 | Tragic 10.7% |
| Immigrants | Zaire | 0.3 /100 | #252 | Tragic 10.7% |