South African vs Colville Family Poverty
COMPARE
South African
Colville
Family Poverty
Family Poverty Comparison
South Africans
Colville
8.2%
FAMILY POVERTY
93.4/ 100
METRIC RATING
116th/ 347
METRIC RANK
13.0%
FAMILY POVERTY
0.0/ 100
METRIC RATING
326th/ 347
METRIC RANK
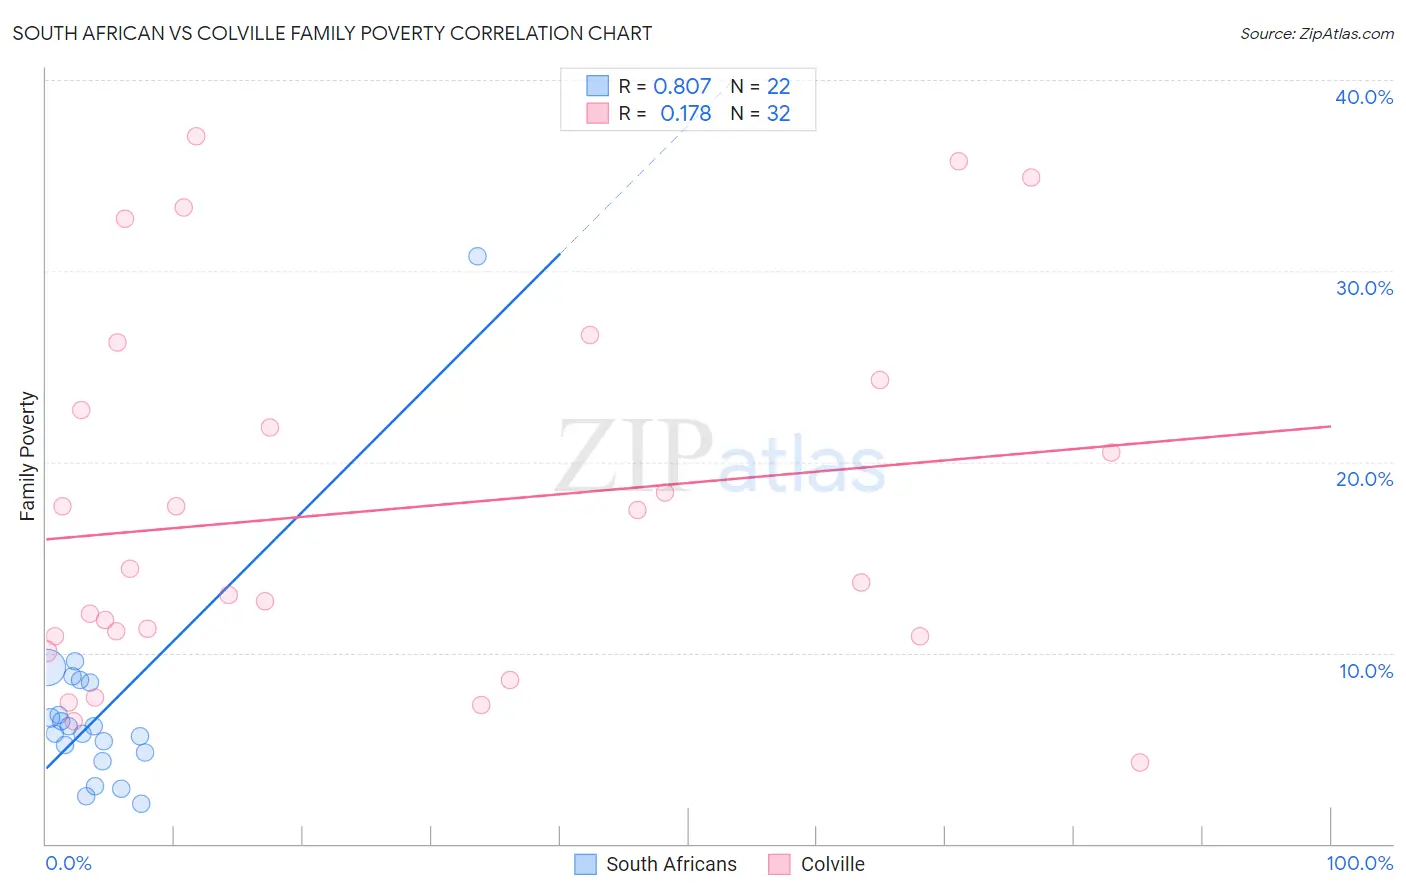
South African vs Colville Family Poverty Correlation Chart
The statistical analysis conducted on geographies consisting of 182,354,069 people shows a very strong positive correlation between the proportion of South Africans and poverty level among families in the United States with a correlation coefficient (R) of 0.807 and weighted average of 8.2%. Similarly, the statistical analysis conducted on geographies consisting of 34,676,230 people shows a poor positive correlation between the proportion of Colville and poverty level among families in the United States with a correlation coefficient (R) of 0.178 and weighted average of 13.0%, a difference of 58.0%.
Family Poverty Correlation Summary
| Measurement | South African | Colville |
| Minimum | 2.1% | 4.3% |
| Maximum | 30.8% | 37.1% |
| Range | 28.7% | 32.8% |
| Mean | 7.0% | 17.5% |
| Median | 6.0% | 14.0% |
| Interquartile 25% (IQ1) | 4.8% | 10.9% |
| Interquartile 75% (IQ3) | 8.4% | 23.5% |
| Interquartile Range (IQR) | 3.7% | 12.6% |
| Standard Deviation (Sample) | 5.7% | 9.5% |
| Standard Deviation (Population) | 5.6% | 9.3% |
Similar Demographics by Family Poverty
Demographics Similar to South Africans by Family Poverty
In terms of family poverty, the demographic groups most similar to South Africans are Immigrants from Israel (8.2%, a difference of 0.060%), Immigrants from Russia (8.2%, a difference of 0.070%), Immigrants from Western Europe (8.2%, a difference of 0.26%), French (8.3%, a difference of 0.33%), and Immigrants from Zimbabwe (8.2%, a difference of 0.41%).
| Demographics | Rating | Rank | Family Poverty |
| Jordanians | 94.8 /100 | #109 | Exceptional 8.2% |
| Romanians | 94.7 /100 | #110 | Exceptional 8.2% |
| Taiwanese | 94.6 /100 | #111 | Exceptional 8.2% |
| Immigrants | France | 94.4 /100 | #112 | Exceptional 8.2% |
| Canadians | 94.2 /100 | #113 | Exceptional 8.2% |
| Immigrants | Zimbabwe | 94.0 /100 | #114 | Exceptional 8.2% |
| Immigrants | Israel | 93.5 /100 | #115 | Exceptional 8.2% |
| South Africans | 93.4 /100 | #116 | Exceptional 8.2% |
| Immigrants | Russia | 93.2 /100 | #117 | Exceptional 8.2% |
| Immigrants | Western Europe | 92.9 /100 | #118 | Exceptional 8.2% |
| French | 92.8 /100 | #119 | Exceptional 8.3% |
| Immigrants | Egypt | 91.6 /100 | #120 | Exceptional 8.3% |
| Native Hawaiians | 91.3 /100 | #121 | Exceptional 8.3% |
| Paraguayans | 91.2 /100 | #122 | Exceptional 8.3% |
| Palestinians | 91.1 /100 | #123 | Exceptional 8.3% |
Demographics Similar to Colville by Family Poverty
In terms of family poverty, the demographic groups most similar to Colville are Paiute (13.0%, a difference of 0.060%), Yakama (13.1%, a difference of 0.68%), Immigrants from Dominica (12.7%, a difference of 2.0%), Menominee (12.7%, a difference of 2.1%), and Central American Indian (13.3%, a difference of 2.4%).
| Demographics | Rating | Rank | Family Poverty |
| British West Indians | 0.0 /100 | #319 | Tragic 12.4% |
| Inupiat | 0.0 /100 | #320 | Tragic 12.5% |
| Arapaho | 0.0 /100 | #321 | Tragic 12.7% |
| Immigrants | Honduras | 0.0 /100 | #322 | Tragic 12.7% |
| Menominee | 0.0 /100 | #323 | Tragic 12.7% |
| Immigrants | Dominica | 0.0 /100 | #324 | Tragic 12.7% |
| Paiute | 0.0 /100 | #325 | Tragic 13.0% |
| Colville | 0.0 /100 | #326 | Tragic 13.0% |
| Yakama | 0.0 /100 | #327 | Tragic 13.1% |
| Central American Indians | 0.0 /100 | #328 | Tragic 13.3% |
| Blacks/African Americans | 0.0 /100 | #329 | Tragic 13.3% |
| Natives/Alaskans | 0.0 /100 | #330 | Tragic 14.3% |
| Cheyenne | 0.0 /100 | #331 | Tragic 14.3% |
| Dominicans | 0.0 /100 | #332 | Tragic 14.3% |
| Immigrants | Dominican Republic | 0.0 /100 | #333 | Tragic 14.4% |