British vs Immigrants from Burma/Myanmar Family Poverty
COMPARE
British
Immigrants from Burma/Myanmar
Family Poverty
Family Poverty Comparison
British
Immigrants from Burma/Myanmar
7.9%
FAMILY POVERTY
97.5/ 100
METRIC RATING
84th/ 347
METRIC RANK
10.5%
FAMILY POVERTY
0.6/ 100
METRIC RATING
245th/ 347
METRIC RANK
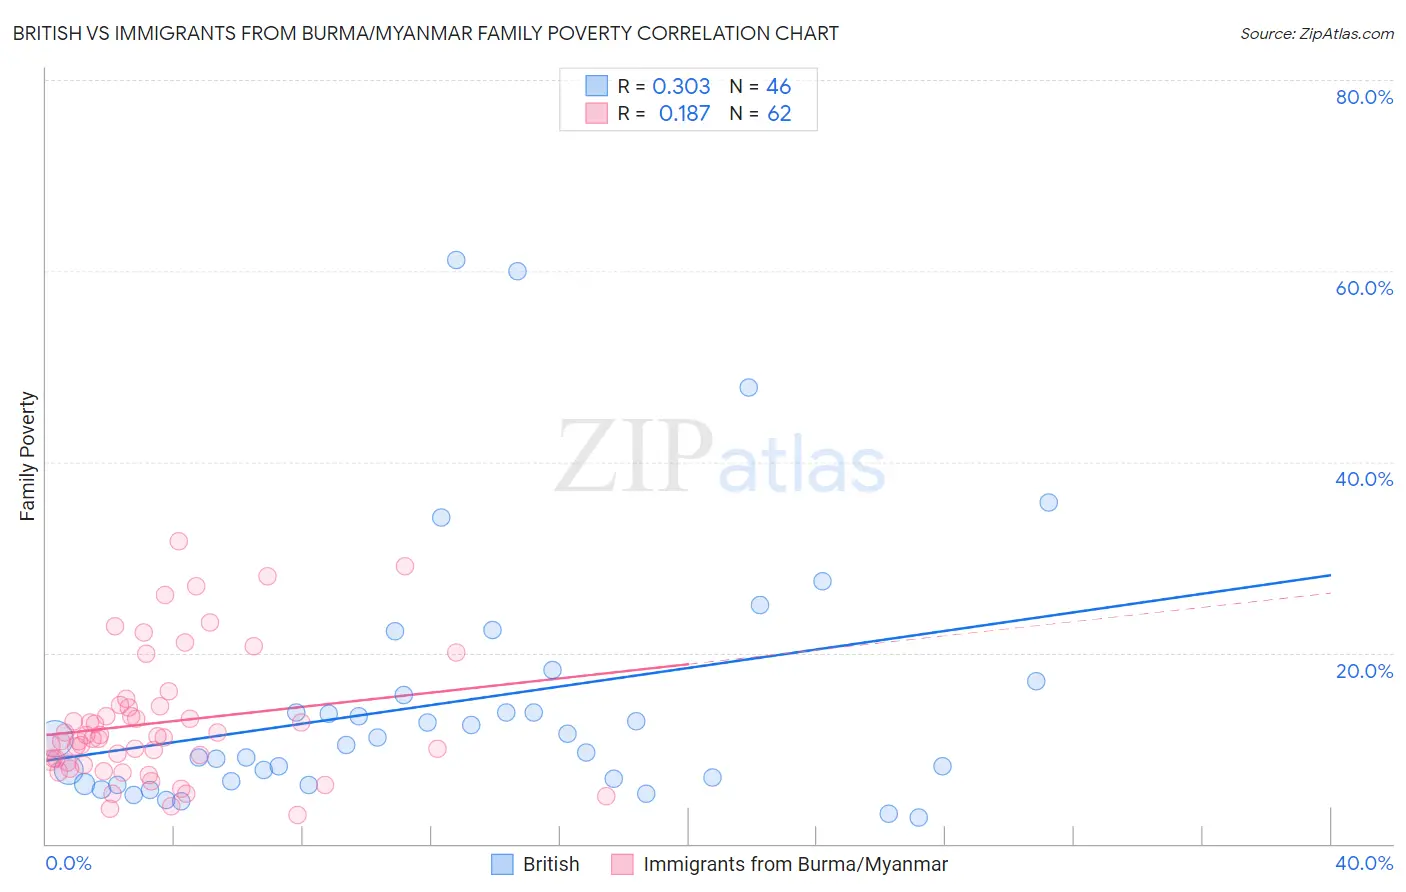
British vs Immigrants from Burma/Myanmar Family Poverty Correlation Chart
The statistical analysis conducted on geographies consisting of 528,449,567 people shows a mild positive correlation between the proportion of British and poverty level among families in the United States with a correlation coefficient (R) of 0.303 and weighted average of 7.9%. Similarly, the statistical analysis conducted on geographies consisting of 172,175,970 people shows a poor positive correlation between the proportion of Immigrants from Burma/Myanmar and poverty level among families in the United States with a correlation coefficient (R) of 0.187 and weighted average of 10.5%, a difference of 32.9%.
Family Poverty Correlation Summary
| Measurement | British | Immigrants from Burma/Myanmar |
| Minimum | 2.7% | 3.0% |
| Maximum | 61.1% | 31.7% |
| Range | 58.4% | 28.7% |
| Mean | 14.8% | 12.7% |
| Median | 10.6% | 11.1% |
| Interquartile 25% (IQ1) | 6.6% | 8.5% |
| Interquartile 75% (IQ3) | 15.5% | 14.4% |
| Interquartile Range (IQR) | 9.0% | 5.8% |
| Standard Deviation (Sample) | 13.5% | 6.6% |
| Standard Deviation (Population) | 13.3% | 6.6% |
Similar Demographics by Family Poverty
Demographics Similar to British by Family Poverty
In terms of family poverty, the demographic groups most similar to British are Slovak (7.9%, a difference of 0.24%), Immigrants from Asia (7.9%, a difference of 0.24%), Scottish (7.9%, a difference of 0.29%), Belgian (8.0%, a difference of 0.37%), and Immigrants from Poland (7.9%, a difference of 0.42%).
| Demographics | Rating | Rank | Family Poverty |
| Ukrainians | 98.0 /100 | #77 | Exceptional 7.9% |
| Immigrants | North America | 97.9 /100 | #78 | Exceptional 7.9% |
| Immigrants | Europe | 97.8 /100 | #79 | Exceptional 7.9% |
| English | 97.8 /100 | #80 | Exceptional 7.9% |
| Irish | 97.8 /100 | #81 | Exceptional 7.9% |
| Immigrants | Poland | 97.8 /100 | #82 | Exceptional 7.9% |
| Slovaks | 97.7 /100 | #83 | Exceptional 7.9% |
| British | 97.5 /100 | #84 | Exceptional 7.9% |
| Immigrants | Asia | 97.4 /100 | #85 | Exceptional 7.9% |
| Scottish | 97.3 /100 | #86 | Exceptional 7.9% |
| Belgians | 97.3 /100 | #87 | Exceptional 8.0% |
| Serbians | 97.2 /100 | #88 | Exceptional 8.0% |
| Immigrants | Denmark | 97.1 /100 | #89 | Exceptional 8.0% |
| Immigrants | England | 97.1 /100 | #90 | Exceptional 8.0% |
| Immigrants | Italy | 97.0 /100 | #91 | Exceptional 8.0% |
Demographics Similar to Immigrants from Burma/Myanmar by Family Poverty
In terms of family poverty, the demographic groups most similar to Immigrants from Burma/Myanmar are Cree (10.5%, a difference of 0.61%), Cherokee (10.6%, a difference of 0.64%), Liberian (10.6%, a difference of 0.73%), Nicaraguan (10.6%, a difference of 0.93%), and Cuban (10.6%, a difference of 0.98%).
| Demographics | Rating | Rank | Family Poverty |
| French American Indians | 1.5 /100 | #238 | Tragic 10.2% |
| Potawatomi | 1.5 /100 | #239 | Tragic 10.2% |
| Immigrants | Azores | 1.4 /100 | #240 | Tragic 10.3% |
| Ghanaians | 1.3 /100 | #241 | Tragic 10.3% |
| Alaska Natives | 1.0 /100 | #242 | Tragic 10.4% |
| Nepalese | 0.8 /100 | #243 | Tragic 10.4% |
| Cree | 0.7 /100 | #244 | Tragic 10.5% |
| Immigrants | Burma/Myanmar | 0.6 /100 | #245 | Tragic 10.5% |
| Cherokee | 0.5 /100 | #246 | Tragic 10.6% |
| Liberians | 0.4 /100 | #247 | Tragic 10.6% |
| Nicaraguans | 0.4 /100 | #248 | Tragic 10.6% |
| Cubans | 0.4 /100 | #249 | Tragic 10.6% |
| Salvadorans | 0.3 /100 | #250 | Tragic 10.7% |
| Iroquois | 0.3 /100 | #251 | Tragic 10.7% |
| Immigrants | Zaire | 0.3 /100 | #252 | Tragic 10.7% |