Somali vs Ottawa Child Poverty Under the Age of 5
COMPARE
Somali
Ottawa
Child Poverty Under the Age of 5
Child Poverty Under the Age of 5 Comparison
Somalis
Ottawa
21.1%
CHILD POVERTY UNDER THE AGE OF 5
0.0/ 100
METRIC RATING
284th/ 347
METRIC RANK
20.3%
CHILD POVERTY UNDER THE AGE OF 5
0.1/ 100
METRIC RATING
267th/ 347
METRIC RANK
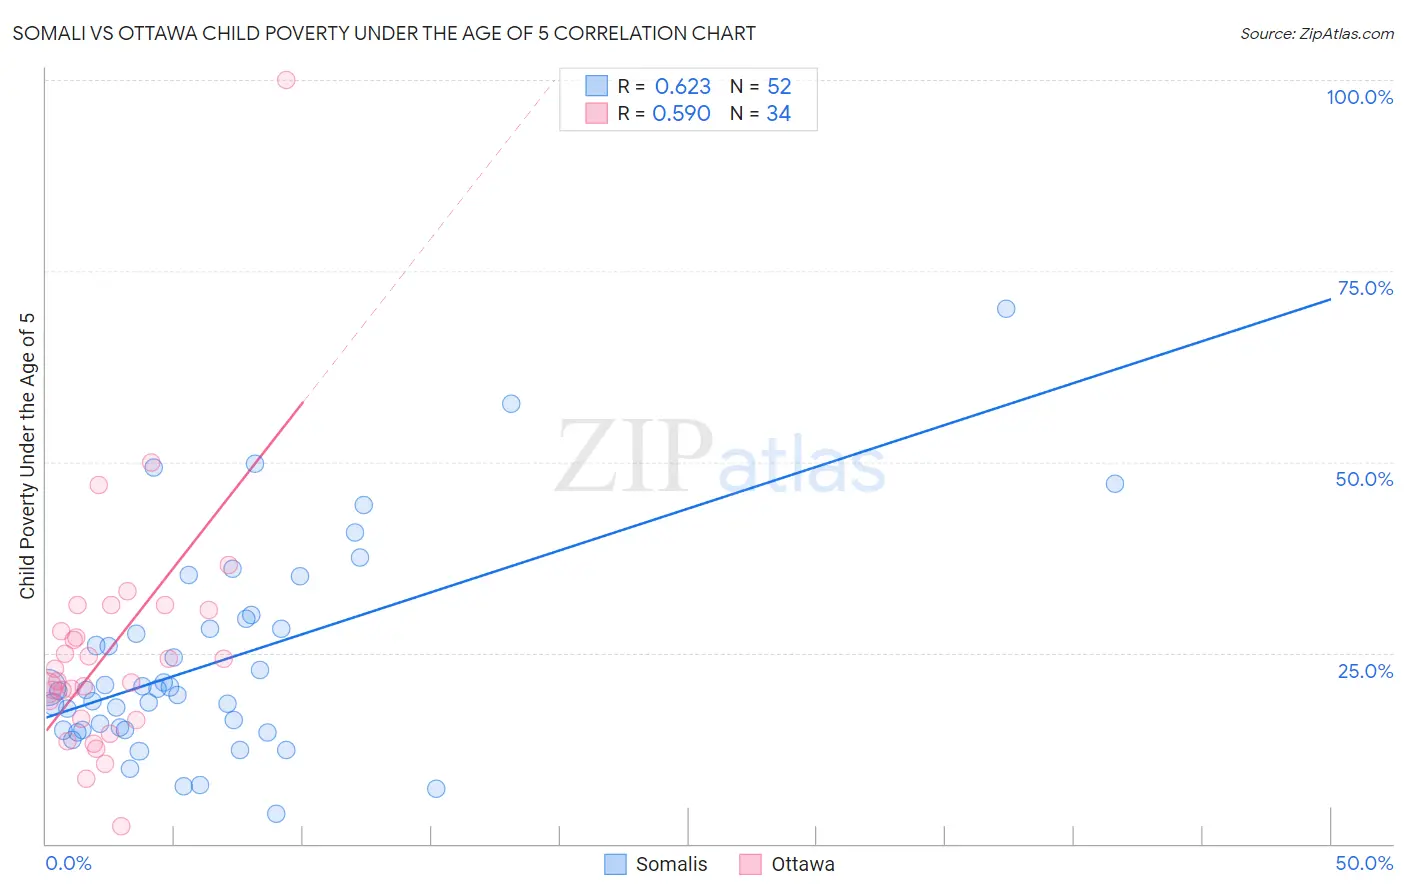
Somali vs Ottawa Child Poverty Under the Age of 5 Correlation Chart
The statistical analysis conducted on geographies consisting of 98,642,642 people shows a significant positive correlation between the proportion of Somalis and poverty level among children under the age of 5 in the United States with a correlation coefficient (R) of 0.623 and weighted average of 21.1%. Similarly, the statistical analysis conducted on geographies consisting of 49,352,699 people shows a substantial positive correlation between the proportion of Ottawa and poverty level among children under the age of 5 in the United States with a correlation coefficient (R) of 0.590 and weighted average of 20.3%, a difference of 3.8%.
Child Poverty Under the Age of 5 Correlation Summary
| Measurement | Somali | Ottawa |
| Minimum | 3.9% | 2.3% |
| Maximum | 70.0% | 100.0% |
| Range | 66.1% | 97.7% |
| Mean | 23.9% | 25.4% |
| Median | 20.2% | 22.1% |
| Interquartile 25% (IQ1) | 14.9% | 16.4% |
| Interquartile 75% (IQ3) | 28.8% | 30.6% |
| Interquartile Range (IQR) | 13.9% | 14.2% |
| Standard Deviation (Sample) | 13.6% | 16.5% |
| Standard Deviation (Population) | 13.4% | 16.2% |
Demographics Similar to Somalis and Ottawa by Child Poverty Under the Age of 5
In terms of child poverty under the age of 5, the demographic groups most similar to Somalis are Comanche (21.0%, a difference of 0.33%), Haitian (21.2%, a difference of 0.47%), Potawatomi (21.0%, a difference of 0.53%), Senegalese (20.9%, a difference of 1.1%), and French American Indian (20.8%, a difference of 1.3%). Similarly, the demographic groups most similar to Ottawa are Belizean (20.3%, a difference of 0.0%), Immigrants from Burma/Myanmar (20.4%, a difference of 0.090%), Jamaican (20.4%, a difference of 0.16%), Aleut (20.3%, a difference of 0.39%), and Spanish American Indian (20.2%, a difference of 0.52%).
| Demographics | Rating | Rank | Child Poverty Under the Age of 5 |
| Spanish American Indians | 0.1 /100 | #265 | Tragic 20.2% |
| Aleuts | 0.1 /100 | #266 | Tragic 20.3% |
| Ottawa | 0.1 /100 | #267 | Tragic 20.3% |
| Belizeans | 0.1 /100 | #268 | Tragic 20.3% |
| Immigrants | Burma/Myanmar | 0.1 /100 | #269 | Tragic 20.4% |
| Jamaicans | 0.1 /100 | #270 | Tragic 20.4% |
| Americans | 0.1 /100 | #271 | Tragic 20.5% |
| Immigrants | Jamaica | 0.1 /100 | #272 | Tragic 20.5% |
| Central Americans | 0.1 /100 | #273 | Tragic 20.6% |
| Immigrants | Belize | 0.1 /100 | #274 | Tragic 20.6% |
| Bangladeshis | 0.1 /100 | #275 | Tragic 20.6% |
| West Indians | 0.0 /100 | #276 | Tragic 20.6% |
| Immigrants | West Indies | 0.0 /100 | #277 | Tragic 20.7% |
| Immigrants | Grenada | 0.0 /100 | #278 | Tragic 20.7% |
| Sub-Saharan Africans | 0.0 /100 | #279 | Tragic 20.8% |
| French American Indians | 0.0 /100 | #280 | Tragic 20.8% |
| Senegalese | 0.0 /100 | #281 | Tragic 20.9% |
| Potawatomi | 0.0 /100 | #282 | Tragic 21.0% |
| Comanche | 0.0 /100 | #283 | Tragic 21.0% |
| Somalis | 0.0 /100 | #284 | Tragic 21.1% |
| Haitians | 0.0 /100 | #285 | Tragic 21.2% |