Somali vs British Child Poverty Under the Age of 5
COMPARE
Somali
British
Child Poverty Under the Age of 5
Child Poverty Under the Age of 5 Comparison
Somalis
British
21.1%
CHILD POVERTY UNDER THE AGE OF 5
0.0/ 100
METRIC RATING
284th/ 347
METRIC RANK
16.3%
CHILD POVERTY UNDER THE AGE OF 5
89.4/ 100
METRIC RATING
129th/ 347
METRIC RANK
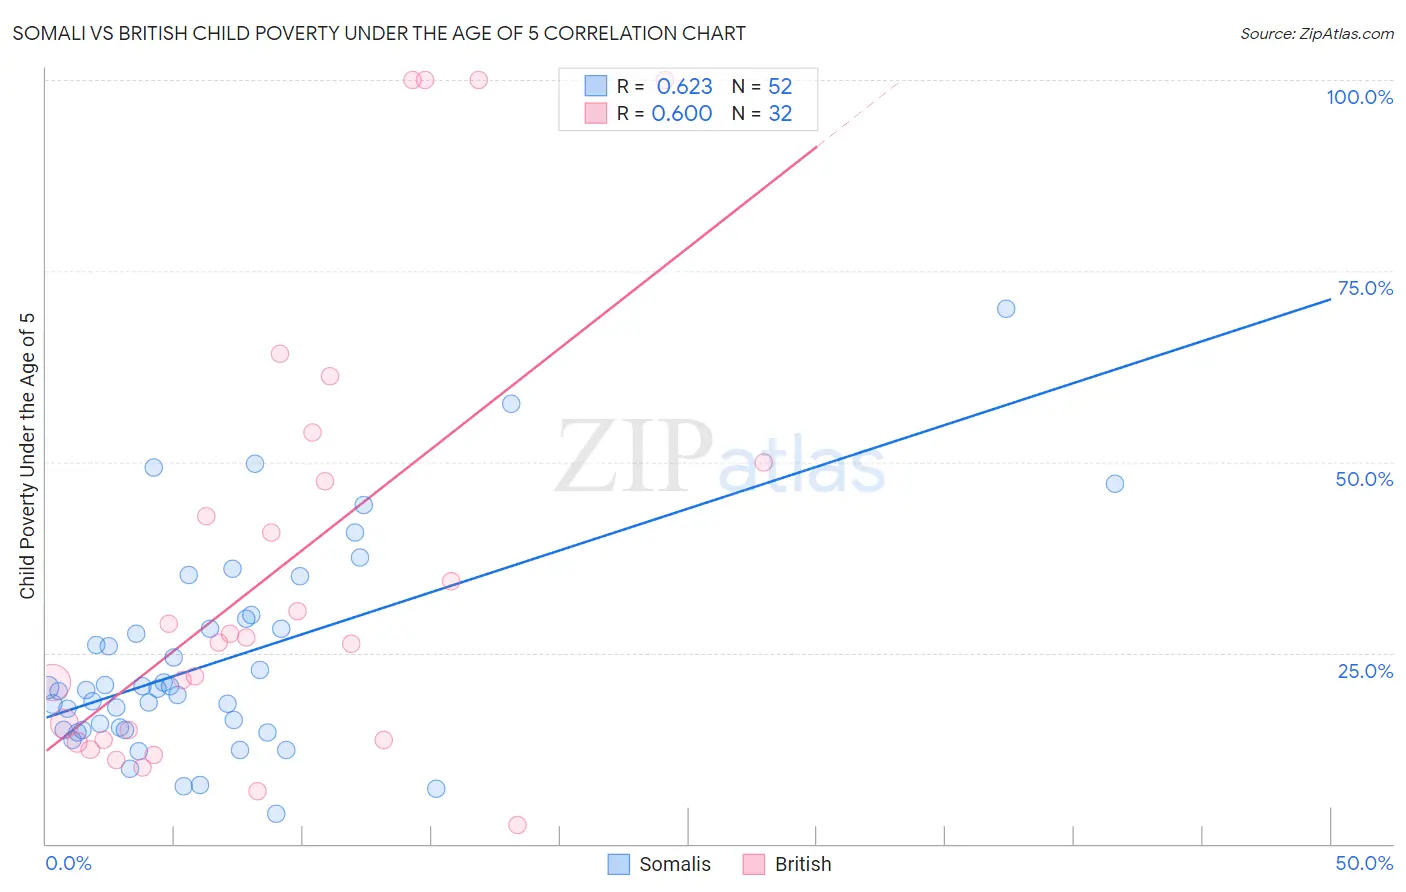
Somali vs British Child Poverty Under the Age of 5 Correlation Chart
The statistical analysis conducted on geographies consisting of 98,642,642 people shows a significant positive correlation between the proportion of Somalis and poverty level among children under the age of 5 in the United States with a correlation coefficient (R) of 0.623 and weighted average of 21.1%. Similarly, the statistical analysis conducted on geographies consisting of 499,115,764 people shows a substantial positive correlation between the proportion of British and poverty level among children under the age of 5 in the United States with a correlation coefficient (R) of 0.600 and weighted average of 16.3%, a difference of 29.7%.
Child Poverty Under the Age of 5 Correlation Summary
| Measurement | Somali | British |
| Minimum | 3.9% | 2.4% |
| Maximum | 70.0% | 100.0% |
| Range | 66.1% | 97.6% |
| Mean | 23.9% | 36.0% |
| Median | 20.2% | 26.7% |
| Interquartile 25% (IQ1) | 14.9% | 13.6% |
| Interquartile 75% (IQ3) | 28.8% | 48.7% |
| Interquartile Range (IQR) | 13.9% | 35.1% |
| Standard Deviation (Sample) | 13.6% | 29.2% |
| Standard Deviation (Population) | 13.4% | 28.7% |
Similar Demographics by Child Poverty Under the Age of 5
Demographics Similar to Somalis by Child Poverty Under the Age of 5
In terms of child poverty under the age of 5, the demographic groups most similar to Somalis are Comanche (21.0%, a difference of 0.33%), Haitian (21.2%, a difference of 0.47%), Potawatomi (21.0%, a difference of 0.53%), Immigrants from Latin America (21.2%, a difference of 0.55%), and Immigrants from Zaire (21.3%, a difference of 0.64%).
| Demographics | Rating | Rank | Child Poverty Under the Age of 5 |
| Immigrants | West Indies | 0.0 /100 | #277 | Tragic 20.7% |
| Immigrants | Grenada | 0.0 /100 | #278 | Tragic 20.7% |
| Sub-Saharan Africans | 0.0 /100 | #279 | Tragic 20.8% |
| French American Indians | 0.0 /100 | #280 | Tragic 20.8% |
| Senegalese | 0.0 /100 | #281 | Tragic 20.9% |
| Potawatomi | 0.0 /100 | #282 | Tragic 21.0% |
| Comanche | 0.0 /100 | #283 | Tragic 21.0% |
| Somalis | 0.0 /100 | #284 | Tragic 21.1% |
| Haitians | 0.0 /100 | #285 | Tragic 21.2% |
| Immigrants | Latin America | 0.0 /100 | #286 | Tragic 21.2% |
| Immigrants | Zaire | 0.0 /100 | #287 | Tragic 21.3% |
| Immigrants | Senegal | 0.0 /100 | #288 | Tragic 21.3% |
| Immigrants | Haiti | 0.0 /100 | #289 | Tragic 21.3% |
| Immigrants | Caribbean | 0.0 /100 | #290 | Tragic 21.4% |
| British West Indians | 0.0 /100 | #291 | Tragic 21.4% |
Demographics Similar to British by Child Poverty Under the Age of 5
In terms of child poverty under the age of 5, the demographic groups most similar to British are Immigrants from Norway (16.3%, a difference of 0.030%), South African (16.2%, a difference of 0.18%), Finnish (16.3%, a difference of 0.32%), Serbian (16.3%, a difference of 0.35%), and Icelander (16.3%, a difference of 0.42%).
| Demographics | Rating | Rank | Child Poverty Under the Age of 5 |
| Immigrants | Southern Europe | 92.0 /100 | #122 | Exceptional 16.1% |
| Austrians | 92.0 /100 | #123 | Exceptional 16.1% |
| Swiss | 92.0 /100 | #124 | Exceptional 16.1% |
| Native Hawaiians | 91.8 /100 | #125 | Exceptional 16.2% |
| Immigrants | Albania | 91.8 /100 | #126 | Exceptional 16.2% |
| Immigrants | England | 91.5 /100 | #127 | Exceptional 16.2% |
| South Africans | 90.1 /100 | #128 | Exceptional 16.2% |
| British | 89.4 /100 | #129 | Excellent 16.3% |
| Immigrants | Norway | 89.3 /100 | #130 | Excellent 16.3% |
| Finns | 88.3 /100 | #131 | Excellent 16.3% |
| Serbians | 88.2 /100 | #132 | Excellent 16.3% |
| Icelanders | 87.9 /100 | #133 | Excellent 16.3% |
| Immigrants | North Macedonia | 87.8 /100 | #134 | Excellent 16.4% |
| Brazilians | 87.8 /100 | #135 | Excellent 16.4% |
| Immigrants | Northern Africa | 87.5 /100 | #136 | Excellent 16.4% |