Somali vs Immigrants from Eastern Europe Family Poverty
COMPARE
Somali
Immigrants from Eastern Europe
Family Poverty
Family Poverty Comparison
Somalis
Immigrants from Eastern Europe
11.2%
FAMILY POVERTY
0.1/ 100
METRIC RATING
273rd/ 347
METRIC RANK
8.1%
FAMILY POVERTY
95.6/ 100
METRIC RATING
103rd/ 347
METRIC RANK
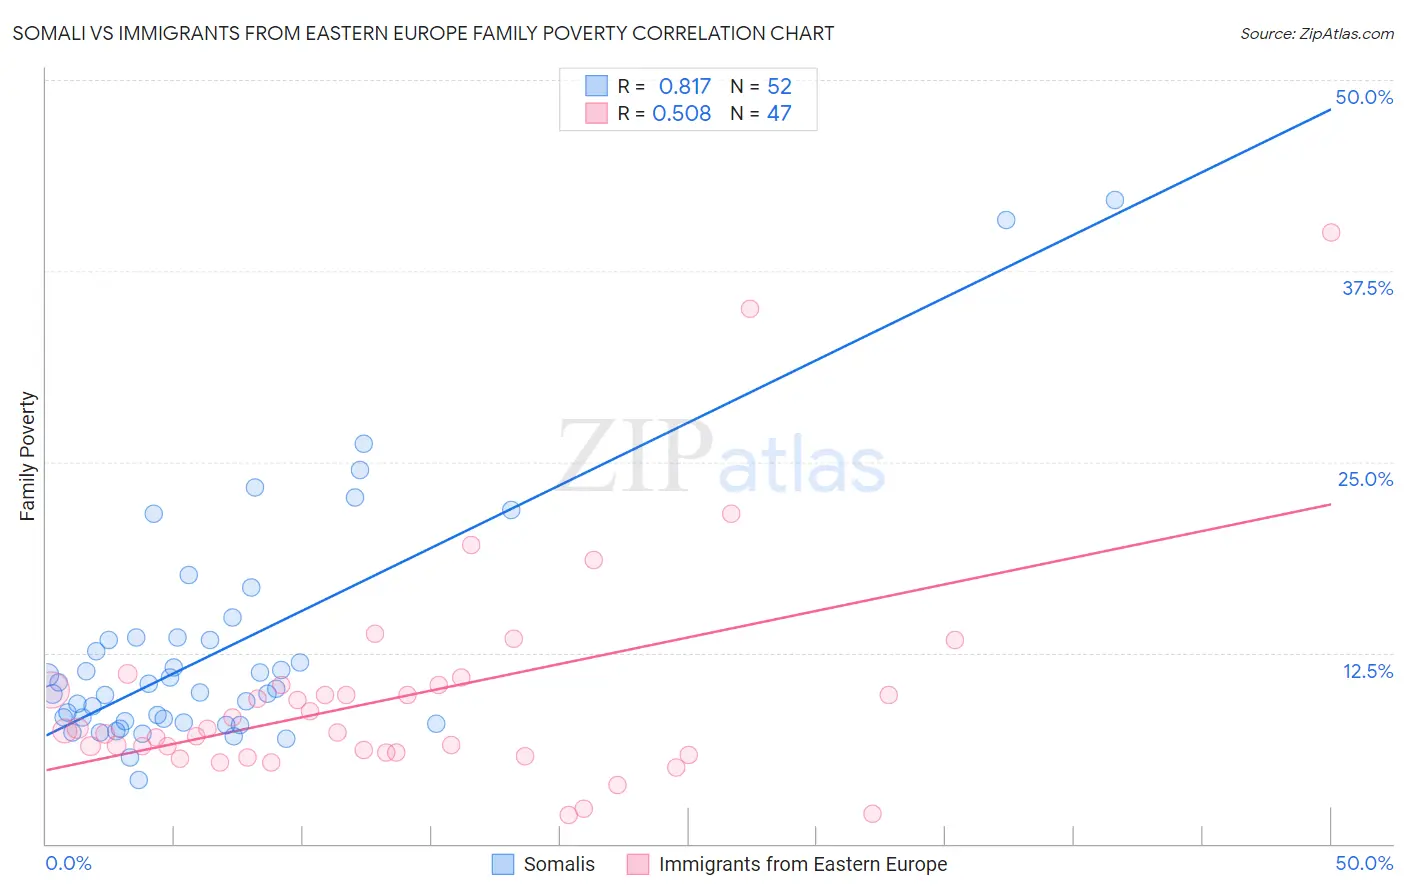
Somali vs Immigrants from Eastern Europe Family Poverty Correlation Chart
The statistical analysis conducted on geographies consisting of 99,253,282 people shows a very strong positive correlation between the proportion of Somalis and poverty level among families in the United States with a correlation coefficient (R) of 0.817 and weighted average of 11.2%. Similarly, the statistical analysis conducted on geographies consisting of 473,559,356 people shows a substantial positive correlation between the proportion of Immigrants from Eastern Europe and poverty level among families in the United States with a correlation coefficient (R) of 0.508 and weighted average of 8.1%, a difference of 38.4%.
Family Poverty Correlation Summary
| Measurement | Somali | Immigrants from Eastern Europe |
| Minimum | 4.2% | 1.9% |
| Maximum | 42.2% | 40.0% |
| Range | 38.0% | 38.1% |
| Mean | 12.6% | 9.6% |
| Median | 10.0% | 7.4% |
| Interquartile 25% (IQ1) | 8.0% | 5.9% |
| Interquartile 75% (IQ3) | 13.4% | 10.4% |
| Interquartile Range (IQR) | 5.5% | 4.4% |
| Standard Deviation (Sample) | 7.7% | 7.2% |
| Standard Deviation (Population) | 7.7% | 7.1% |
Similar Demographics by Family Poverty
Demographics Similar to Somalis by Family Poverty
In terms of family poverty, the demographic groups most similar to Somalis are Spanish American (11.2%, a difference of 0.090%), Central American (11.2%, a difference of 0.13%), Immigrants from Guyana (11.2%, a difference of 0.16%), Chippewa (11.2%, a difference of 0.25%), and Guyanese (11.2%, a difference of 0.28%).
| Demographics | Rating | Rank | Family Poverty |
| Immigrants | El Salvador | 0.1 /100 | #266 | Tragic 11.0% |
| Comanche | 0.1 /100 | #267 | Tragic 11.0% |
| Jamaicans | 0.1 /100 | #268 | Tragic 11.1% |
| Immigrants | Ecuador | 0.1 /100 | #269 | Tragic 11.1% |
| Immigrants | Nicaragua | 0.1 /100 | #270 | Tragic 11.1% |
| Immigrants | Bahamas | 0.1 /100 | #271 | Tragic 11.1% |
| Immigrants | Jamaica | 0.1 /100 | #272 | Tragic 11.2% |
| Somalis | 0.1 /100 | #273 | Tragic 11.2% |
| Spanish Americans | 0.1 /100 | #274 | Tragic 11.2% |
| Central Americans | 0.1 /100 | #275 | Tragic 11.2% |
| Immigrants | Guyana | 0.1 /100 | #276 | Tragic 11.2% |
| Chippewa | 0.1 /100 | #277 | Tragic 11.2% |
| Guyanese | 0.1 /100 | #278 | Tragic 11.2% |
| Blackfeet | 0.0 /100 | #279 | Tragic 11.3% |
| Belizeans | 0.0 /100 | #280 | Tragic 11.3% |
Demographics Similar to Immigrants from Eastern Europe by Family Poverty
In terms of family poverty, the demographic groups most similar to Immigrants from Eastern Europe are Slavic (8.1%, a difference of 0.010%), Laotian (8.1%, a difference of 0.040%), Immigrants from Indonesia (8.1%, a difference of 0.090%), Immigrants from Norway (8.1%, a difference of 0.10%), and New Zealander (8.1%, a difference of 0.13%).
| Demographics | Rating | Rank | Family Poverty |
| Immigrants | Turkey | 96.5 /100 | #96 | Exceptional 8.0% |
| Immigrants | Switzerland | 96.1 /100 | #97 | Exceptional 8.1% |
| Immigrants | South Africa | 95.9 /100 | #98 | Exceptional 8.1% |
| Welsh | 95.8 /100 | #99 | Exceptional 8.1% |
| New Zealanders | 95.8 /100 | #100 | Exceptional 8.1% |
| Immigrants | Norway | 95.7 /100 | #101 | Exceptional 8.1% |
| Immigrants | Indonesia | 95.7 /100 | #102 | Exceptional 8.1% |
| Immigrants | Eastern Europe | 95.6 /100 | #103 | Exceptional 8.1% |
| Slavs | 95.6 /100 | #104 | Exceptional 8.1% |
| Laotians | 95.6 /100 | #105 | Exceptional 8.1% |
| Egyptians | 95.1 /100 | #106 | Exceptional 8.1% |
| French Canadians | 95.0 /100 | #107 | Exceptional 8.1% |
| Basques | 94.9 /100 | #108 | Exceptional 8.1% |
| Jordanians | 94.8 /100 | #109 | Exceptional 8.2% |
| Romanians | 94.7 /100 | #110 | Exceptional 8.2% |