Slovene vs Samoan Family Poverty
COMPARE
Slovene
Samoan
Family Poverty
Family Poverty Comparison
Slovenes
Samoans
7.5%
FAMILY POVERTY
99.3/ 100
METRIC RATING
40th/ 347
METRIC RANK
8.6%
FAMILY POVERTY
79.8/ 100
METRIC RATING
152nd/ 347
METRIC RANK
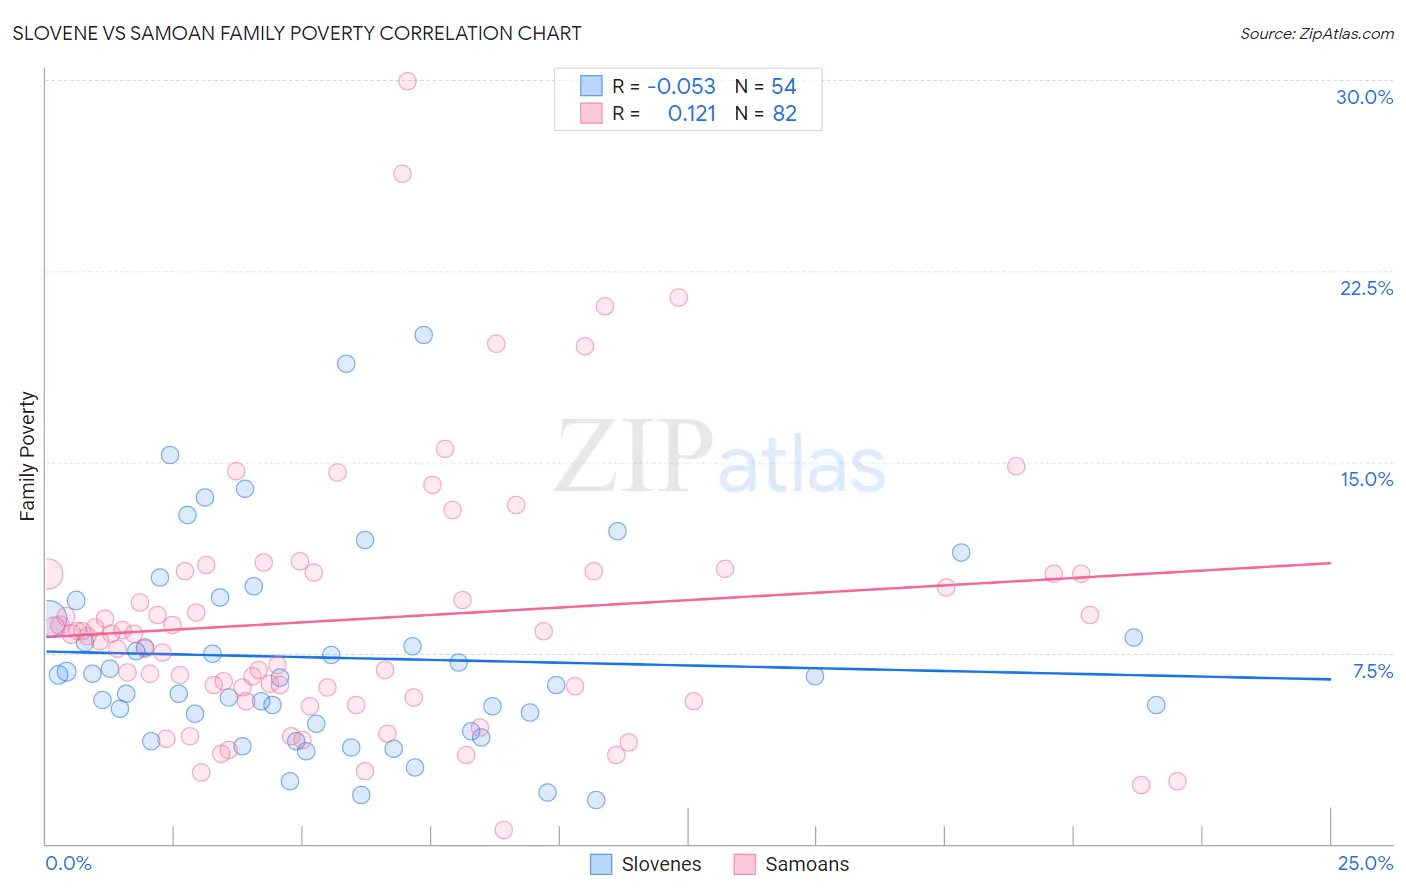
Slovene vs Samoan Family Poverty Correlation Chart
The statistical analysis conducted on geographies consisting of 260,812,664 people shows a slight negative correlation between the proportion of Slovenes and poverty level among families in the United States with a correlation coefficient (R) of -0.053 and weighted average of 7.5%. Similarly, the statistical analysis conducted on geographies consisting of 224,914,322 people shows a poor positive correlation between the proportion of Samoans and poverty level among families in the United States with a correlation coefficient (R) of 0.121 and weighted average of 8.6%, a difference of 14.0%.
Family Poverty Correlation Summary
| Measurement | Slovene | Samoan |
| Minimum | 1.7% | 0.54% |
| Maximum | 20.0% | 29.9% |
| Range | 18.3% | 29.4% |
| Mean | 7.3% | 8.8% |
| Median | 6.6% | 8.2% |
| Interquartile 25% (IQ1) | 4.7% | 5.7% |
| Interquartile 75% (IQ3) | 8.8% | 10.6% |
| Interquartile Range (IQR) | 4.1% | 4.9% |
| Standard Deviation (Sample) | 4.0% | 5.2% |
| Standard Deviation (Population) | 3.9% | 5.1% |
Similar Demographics by Family Poverty
Demographics Similar to Slovenes by Family Poverty
In terms of family poverty, the demographic groups most similar to Slovenes are Carpatho Rusyn (7.5%, a difference of 0.040%), Bolivian (7.5%, a difference of 0.10%), Immigrants from Australia (7.6%, a difference of 0.30%), Estonian (7.5%, a difference of 0.34%), and Turkish (7.5%, a difference of 0.51%).
| Demographics | Rating | Rank | Family Poverty |
| Immigrants | Japan | 99.5 /100 | #33 | Exceptional 7.4% |
| Russians | 99.5 /100 | #34 | Exceptional 7.5% |
| Greeks | 99.4 /100 | #35 | Exceptional 7.5% |
| Turks | 99.4 /100 | #36 | Exceptional 7.5% |
| Estonians | 99.4 /100 | #37 | Exceptional 7.5% |
| Bolivians | 99.3 /100 | #38 | Exceptional 7.5% |
| Carpatho Rusyns | 99.3 /100 | #39 | Exceptional 7.5% |
| Slovenes | 99.3 /100 | #40 | Exceptional 7.5% |
| Immigrants | Australia | 99.2 /100 | #41 | Exceptional 7.6% |
| Scandinavians | 99.1 /100 | #42 | Exceptional 7.6% |
| Immigrants | Austria | 99.1 /100 | #43 | Exceptional 7.6% |
| Germans | 99.0 /100 | #44 | Exceptional 7.7% |
| Okinawans | 98.9 /100 | #45 | Exceptional 7.7% |
| Tongans | 98.9 /100 | #46 | Exceptional 7.7% |
| Immigrants | Czechoslovakia | 98.9 /100 | #47 | Exceptional 7.7% |
Demographics Similar to Samoans by Family Poverty
In terms of family poverty, the demographic groups most similar to Samoans are Brazilian (8.6%, a difference of 0.080%), Mongolian (8.6%, a difference of 0.13%), Syrian (8.6%, a difference of 0.13%), Immigrants from Spain (8.6%, a difference of 0.14%), and Scotch-Irish (8.6%, a difference of 0.54%).
| Demographics | Rating | Rank | Family Poverty |
| Immigrants | South Eastern Asia | 83.2 /100 | #145 | Excellent 8.5% |
| Immigrants | Belarus | 83.2 /100 | #146 | Excellent 8.5% |
| Immigrants | Jordan | 83.0 /100 | #147 | Excellent 8.5% |
| Scotch-Irish | 82.2 /100 | #148 | Excellent 8.6% |
| Mongolians | 80.4 /100 | #149 | Excellent 8.6% |
| Syrians | 80.3 /100 | #150 | Excellent 8.6% |
| Brazilians | 80.1 /100 | #151 | Excellent 8.6% |
| Samoans | 79.8 /100 | #152 | Good 8.6% |
| Immigrants | Spain | 79.1 /100 | #153 | Good 8.6% |
| Immigrants | Vietnam | 75.4 /100 | #154 | Good 8.7% |
| Immigrants | Kuwait | 73.6 /100 | #155 | Good 8.7% |
| Immigrants | Oceania | 71.2 /100 | #156 | Good 8.7% |
| Tsimshian | 69.3 /100 | #157 | Good 8.8% |
| Whites/Caucasians | 69.1 /100 | #158 | Good 8.8% |
| Peruvians | 68.0 /100 | #159 | Good 8.8% |