Immigrants from Singapore vs American Female Poverty
COMPARE
Immigrants from Singapore
American
Female Poverty
Female Poverty Comparison
Immigrants from Singapore
Americans
11.8%
FEMALE POVERTY
99.4/ 100
METRIC RATING
34th/ 347
METRIC RANK
14.6%
FEMALE POVERTY
2.8/ 100
METRIC RATING
224th/ 347
METRIC RANK
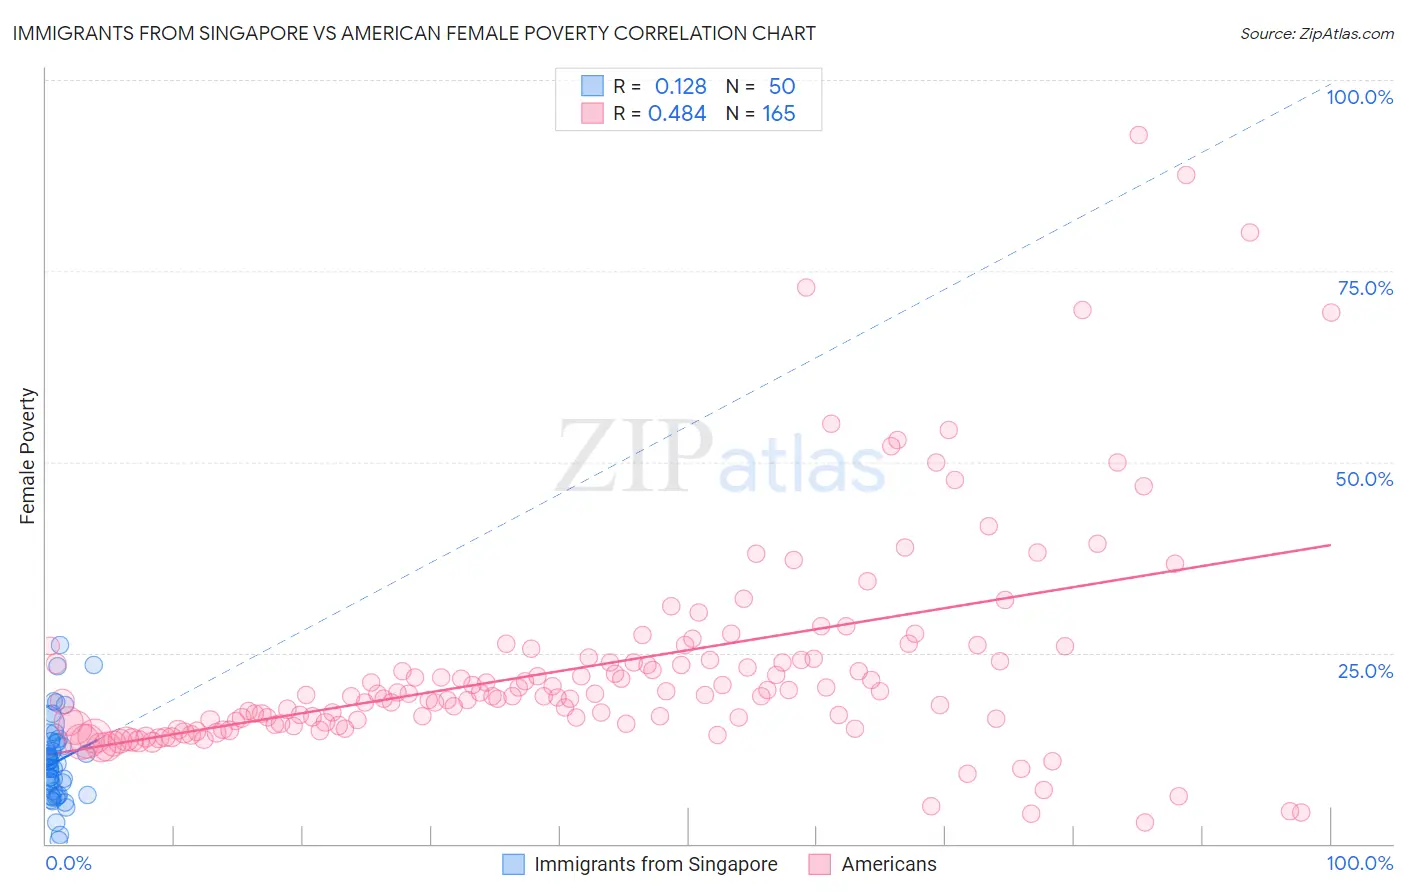
Immigrants from Singapore vs American Female Poverty Correlation Chart
The statistical analysis conducted on geographies consisting of 137,378,092 people shows a poor positive correlation between the proportion of Immigrants from Singapore and poverty level among females in the United States with a correlation coefficient (R) of 0.128 and weighted average of 11.8%. Similarly, the statistical analysis conducted on geographies consisting of 580,452,032 people shows a moderate positive correlation between the proportion of Americans and poverty level among females in the United States with a correlation coefficient (R) of 0.484 and weighted average of 14.6%, a difference of 24.0%.
Female Poverty Correlation Summary
| Measurement | Immigrants from Singapore | American |
| Minimum | 0.53% | 2.7% |
| Maximum | 26.0% | 92.7% |
| Range | 25.5% | 90.0% |
| Mean | 10.7% | 23.2% |
| Median | 10.3% | 19.4% |
| Interquartile 25% (IQ1) | 6.4% | 15.6% |
| Interquartile 75% (IQ3) | 13.2% | 24.2% |
| Interquartile Range (IQR) | 6.9% | 8.5% |
| Standard Deviation (Sample) | 5.4% | 14.5% |
| Standard Deviation (Population) | 5.3% | 14.5% |
Similar Demographics by Female Poverty
Demographics Similar to Immigrants from Singapore by Female Poverty
In terms of female poverty, the demographic groups most similar to Immigrants from Singapore are Cypriot (11.8%, a difference of 0.12%), Immigrants from Iran (11.8%, a difference of 0.17%), Danish (11.7%, a difference of 0.19%), Polish (11.7%, a difference of 0.32%), and Immigrants from Pakistan (11.8%, a difference of 0.34%).
| Demographics | Rating | Rank | Female Poverty |
| Iranians | 99.6 /100 | #27 | Exceptional 11.7% |
| Immigrants | Korea | 99.6 /100 | #28 | Exceptional 11.7% |
| Immigrants | North Macedonia | 99.6 /100 | #29 | Exceptional 11.7% |
| Greeks | 99.5 /100 | #30 | Exceptional 11.7% |
| Poles | 99.5 /100 | #31 | Exceptional 11.7% |
| Danes | 99.5 /100 | #32 | Exceptional 11.7% |
| Cypriots | 99.5 /100 | #33 | Exceptional 11.8% |
| Immigrants | Singapore | 99.4 /100 | #34 | Exceptional 11.8% |
| Immigrants | Iran | 99.4 /100 | #35 | Exceptional 11.8% |
| Immigrants | Pakistan | 99.4 /100 | #36 | Exceptional 11.8% |
| Immigrants | Greece | 99.3 /100 | #37 | Exceptional 11.8% |
| Russians | 99.3 /100 | #38 | Exceptional 11.8% |
| Immigrants | Poland | 99.3 /100 | #39 | Exceptional 11.8% |
| Macedonians | 99.3 /100 | #40 | Exceptional 11.8% |
| Czechs | 99.2 /100 | #41 | Exceptional 11.9% |
Demographics Similar to Americans by Female Poverty
In terms of female poverty, the demographic groups most similar to Americans are Immigrants from Micronesia (14.6%, a difference of 0.0%), Immigrants from Eritrea (14.6%, a difference of 0.33%), Immigrants from Africa (14.5%, a difference of 0.39%), Nonimmigrants (14.5%, a difference of 0.63%), and Immigrants from Nigeria (14.7%, a difference of 0.64%).
| Demographics | Rating | Rank | Female Poverty |
| Immigrants | Immigrants | 4.5 /100 | #217 | Tragic 14.4% |
| Immigrants | Uzbekistan | 4.4 /100 | #218 | Tragic 14.4% |
| Japanese | 4.1 /100 | #219 | Tragic 14.5% |
| Alsatians | 4.0 /100 | #220 | Tragic 14.5% |
| Immigrants | Cambodia | 3.7 /100 | #221 | Tragic 14.5% |
| Immigrants | Nonimmigrants | 3.7 /100 | #222 | Tragic 14.5% |
| Immigrants | Africa | 3.3 /100 | #223 | Tragic 14.5% |
| Americans | 2.8 /100 | #224 | Tragic 14.6% |
| Immigrants | Micronesia | 2.8 /100 | #225 | Tragic 14.6% |
| Immigrants | Eritrea | 2.4 /100 | #226 | Tragic 14.6% |
| Immigrants | Nigeria | 2.1 /100 | #227 | Tragic 14.7% |
| German Russians | 2.0 /100 | #228 | Tragic 14.7% |
| Ghanaians | 1.9 /100 | #229 | Tragic 14.7% |
| Alaska Natives | 1.8 /100 | #230 | Tragic 14.7% |
| Nigerians | 1.7 /100 | #231 | Tragic 14.8% |